Wednesday, August 24, 2011

Trade Idea HOV Part 2 (long)

HOV was an earlier long trade, it has pulled back and looks like it wants to move up again soon.
 HOV 15 min chart with the first wave of accumulation and then distribution, the pullback and now a second wave of accumulation.

The 10 min chart confirms it. The 1 and 5 min aren't in line yet, but HOV is starting to trade laterally, that's when we often see accumulation. I wouldn't be opposed to a position here with an initial wide stop. Remember because of its price, HOV s a speculative trade and risk management should reflect that.

Transports Cont...

I just took a quick look at FDX, and the charts are nearly identical to the Dow 20, I'd have that one on my radar.

Transports Look AMAZING

 DJ-20 60 mn chart, that's a huge leading positive divergence.

 This is what I expected and still wonder if the broader market will do, a head fake new low on a "W" bottom, look at the relative divergence between the first low and the second lower low!

 The 15 min chart is even more amazing, and it's in a leading positive divergence.

As is the 10 min chart.

I'd definitely be looking as some transports...

Miners Trading System Update-Long Dust

A Long Dust signal was executed yesterday morning on the open.

 Here's the long signal, up about 9.6% in 2 days.

 Here's the long term 3C accumulation signal, it looks like DUST has more upside, but I think it will be rocky.

 The 15 min 3C chart

 The 5 min is starting to signal a pullback.

 The 1 min is signaling a pullback now. Remember the bounce I thought we'd see in GLD, it will probably have the inverse effect on DUST.

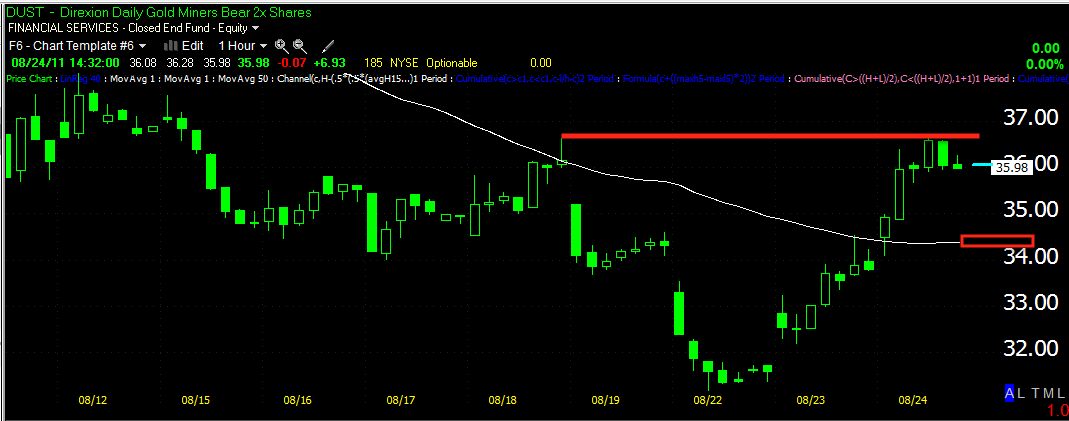
We are at some resistance, I would think we'll pullback at least to the 50-bar ma on a 60 min chart. You may want to take profits here and re-establish a position on a pullback. The longer term charts seem to indicate that the DUST uptrend ill last for a while, but as I said, will be a bumpy ride.

Market Update

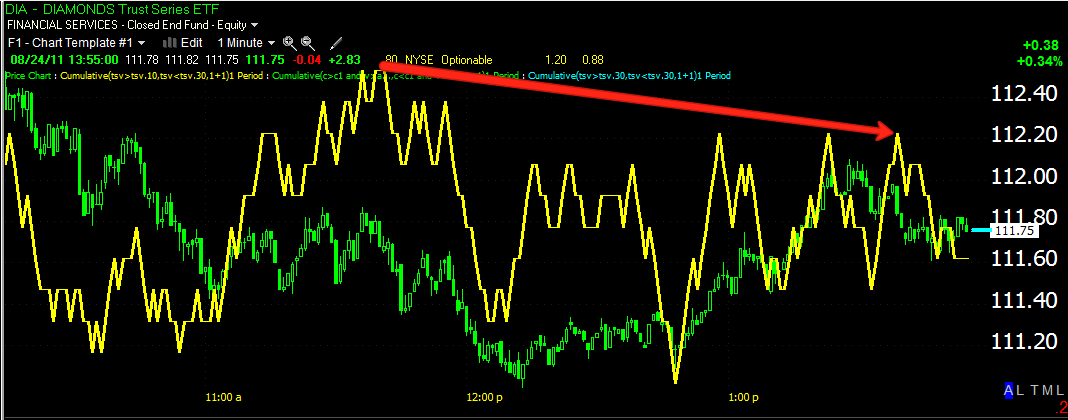
 DIA 1 min negative relative divergence

 DIA 5 min negative, relative divergence

 DIA 10 min mostly in line right now.

 IWM 1 min -a small negative divergence off  nice positive divergence on the earlier dip.

 IWM 5 min, I would say this is close to inline, but comparing the relative points in the red boxes, theres a relative negative divergence.

 IWM 15 min Leading positive divergence, making new highs.

 QQQ 1 min somewhat negative divergence, but it's difficult to say because price and 3C are still moving up and lower then the relative point being compared to.

 The 10 min QQQ is short of the same, but it is clearly lagging a bit more.

 The 15 min must be called a negative divergence

 QQQ 30 mn Positive leading divergence

 SPY 1 min better than inline-leading positive divergence

 SPY 5 min also difficult to call a negative divergence because of the positioning, but it i lagging a bit.

SPY 15 min , leading positive divergence, at a new high

Today seems to be a consolidation day of sorts, the SPY needs to break $118 on some volume to get momentum flowing again.

Gold and Silver Update

It looks like gold and silver (gold a bit more) are going to stage another bounce / consolidation. In certain instances where you have a decent profit, I might consider taking some of the profit off the table and trailing a stop, you can always add on the bounce failure.

 GLD 1 min

 GLD 2 min

 GLD 5 min-this is the one that has me thinking it may be a decent bounce.

SPY 5 min, also seems ready to correct a bit, however, GLD should see a bigger correction.

MCRL -I Hope You Had Your Alerts Set

I covered MCRL earlier today, some of you entered the trade yesterday and should be up 4+% in a day. In any case, it showed good promise from the more important longer term charts, PLUS, the suggested stop for those of you using my Trend Channel was NEVER touched, but it would have made for an excellent low risk entry by watching price and the Trend Channel. If you don't have a system that allows you to set real time alerts, get in touch with me.

 Here's the "W" shaped pattern and today's breakout.

 Volume has been low so far today, but most of that has been on the consolidation, volume picked up on the move through resistance.

 The 10 min chart showed this as simply a consolidation.

 Here you can see the false breakout in the red box with a 3C negative divergence as well as a large period of accumulation with a positive leading divergence on the hourly chart, a very important timeframe.

Finally, the suggested stop using my Trend Channel, t was nowhere near being stopped out today, but the candlesticks along with the TC would have given you good placement with high probabilities (look at the hourly 3C chart) and low risk (see the above chart). I still think it's probably a decent buy even here, there was quite a large zone of accumulation.


GLD Update

've been warning now for several weeks that something was wrong with GLD, 3C wasn't keeping pace, there were multiple negative divergences, etc. In a post this week I asked, Is Something Broke In Gold ?

I also knew we had people with positions in DZZ and short silver as well as puts on GLD and wondered how some of our traders were doing, I got a response earlier today from one of our options traders, he's up  118% and 108% with puts on GLD. That's what I like to hear!

Here's GLD as of now...
 Here's the daily chart, talk about a bull trap, nearly two weeks of gold longs are underwater now. The red arrow shows a support zone that may see a consolidation in GLD, but I think it has further to go based on how bad many of the charts have looked and a few other reasons I will touch on.

 Here's the final 10 min distribution chart and reversal in GLD, currently confirming the downtrend.


Earlier the 5 min chart hit a relative positive divergence and we got a small consolidation from that, I believe that is in the history books now.

I would probably look to a trailing stop for partial profits and let the rest run, and adjust according to the signals that we get as we move forward.

The fact that margin has been increased twice this month in Shanghai and I believe through a few independent brokers, won't hep the gold longs. Also as I mentioned, Paulson's fund had it's 5 top holdings 4 of which were massive losers, I warned, the only long position he has to meet redemptions is GLD and if he starts selling, he can knock GLD down in a single day by 5% or more alone. We may be seeing that right now.


A Couple of Hints The Market May Stabilize

One hint is the TICK chart is moving out of the downtrend it's been in nearly all day. Here are the others.


 Energy is showing the start of a positive divergence

 So are financials

 The Euro looks like it's about to strengthen, which will put downside pressure on the dollar, which will alleviate pressure on equities.

Here's the dollar showing a negative divergence on a 1 min chart, these are just forming so t may take a bit more, but they all point to some stabilization for equities.

SLV Update

This entire Silver episode started last Wednesday August 18th with this post.


In the post I showed you a chart like this (except this one is up to date).
This is what we were looking at in the white box back then, I said in the above post,


"Here's an hourly chart of SLV in a bearish ascending wedge, most traders expect a straight drop down out of the wedge, because it is so obvious, it is likely to be gamed, so I would look for a breakout to the upside, maybe even a new local high and then a plunge in SLV, lifting ZSL. It shouldn't be long now that the wedge is so tight."


As you can see, because of the predictability of technical traders, all 3 things happened, the break out above the wedge, the breakout above local highs and the failure back below-this is a HEAD FAKE.


Yesterday in this update I showed you a chart like this.
These were the two areas of support to watch for and we had talked about a short on silver using ZSL.


Here are the current 3C charts, but now there's a head fake in place, it gives the downside more momentum as the longs are forced to sell or raise margin money.


 SLV 15 min 3C from a negative divergence to trading in line with price  or confirmation of the trend (green arrow=inline)

 SLV 5 min is more detailed, it shows the negative SLV divergence in red and confirmation in green

 The SLV 1 min chart shows a slight positive divergence, likely a slight intraday bounce or a consolidation.

 Here's the SLV short, ZSL on a 15 min timeframe showing distribution around 8/9 on a false upside breakout,  accumulation from 8/15-8/23 and is currently in a positive leading divergence-the strongest kind of divergence on an important timeframe.

 ZSL 10 min showing accumulation and trading in line with price

 ZSL 5 min with accumulation and a slight negative divergence, again indicating either a pullback or a consolidation.

The ZSL 1 min chart again showing the same. All in all, the longer timeframe charts look pretty good so I would expect more downside in SLV and upside in ZSL. GLD coming up.