Monday, September 12, 2011

The Other Averages

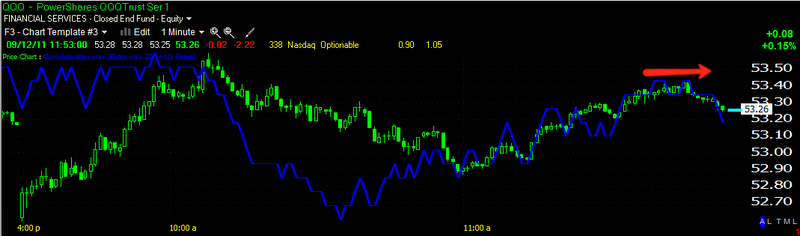
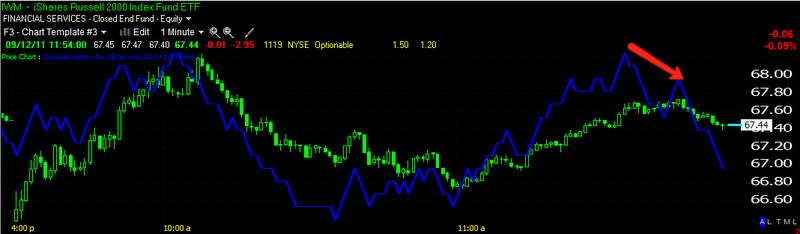
I just showed you the start of a 1 min intraday negative divergence in the SPY, here are the other averages...
 DIA 1 min

 IWM 1 min

QQQ 1 min

I'm still holding the remainder of my shorts, I haven't moved anything yet today.

Update

 The Euro in green helped lift the market for the test of the flag's resistance. A move down here will add strength to the dollar intraday and put pressure on the market intraday.

 This morning's SPY action. To the right there's the start of a negative divergence at the test of resistance of the bear flag.

 As for the slightly longer term picture, meaning the short term bounce I talked about last night, The underlying weakness in the dollar here is equity/stock positive. This is more relating to a bounce over a day or tow, and not the intraday action we've been watching and what I referenced above.

 UUP 10 mn is also showing underlying weakness which should help a bounce.

The same is true of the more important 15 min. UUP chart.

Market Update

So far the 5 min charts are responding positively and adding to their positive divergences, the 10 min charts haven't moved much as of yet.

As far as being in a reversal area, whether we are at a bottom right here or not is hard to say intraday, but the general area being below the bear flag, creating a head fake is a pretty good spot and what I generally look for. We are going to see some upside / we are seeing some intraday upside fro the last positive divergence I posted, this volatility s common near support/resistance, such as the bear flag we broke below.

I'm going to try to stay patient here and see what else works out, but pinning the exact bottom is kind of a fool's game. We're in a decent area now, but I do want to see what happens around that resistance area of the flag.

Market Update

We still are using the shorter charts and shorter trades because we are still in a choppy environment and trying to hold trades for more then a few days right here and now is portfolio suicide.

 This is this morning's action so far with the positive divergence on the open sending prices higher, a negative divergence once the gap was filled sending prices lower and now we have broken below the daily bear flag's support and are seeing a small positive divergence, which we often see some sort of volatility as we cross important support/resistance areas.

Here's the SPY daily chart and bear flag I showed you last night, I mentioned the likelihood of a head fake break below the flag's support such as we have already sen today thus far.

Market Update

Patience has always been a problem for me, when trading exclusively for a living I had to set a rule that I wouldn't trade the first hour of the market. There's a Wall Street saying about entering positions cautiously and getting out quickly. I suppose it makes some sense, but while a profit is seemingly a good thing, taking too small of a profit can be very bad and not enough to offset all the small losers we call experience. So I struggle with patience, even though I think it is one of our biggest advantages over Wall Street. It's good to know your weakness and work to fix it; I may post on that later.

Here's the 1 min charts now, as suspected the a.m. early trade is fading, apparently the market was "supposedly" up on a QE3 rumor out of some think tank, it was appropriately timed to wipe out a good chunk of the retail limit order traders-how convenient...

 DIA 1 min leading negative divergence

 QQQ 1 min leading negative divergence

SPY 1 min leading negative divergence.

The bounce theory from last night is still alive and well, but as I always say, it's a process, not an event.

Since the last update

The SPY and IWM 1 min charts have gone negative as well and we are seeing the downside.
SPY 3C 1 min.

Early Market Update

Now the gap has been filled some of the 1 min charts are starting to suggest the morning range will form, this is where I'll be looking at taking the rest of my profits on short positions so long as everything looks ok, I will of course let you know.

 DIA 1 min negative divergence

QQQ 1 min just going negative now

FX/Euro

Right now and since the open, the trend in the EUR/USD is sending the Dollar Index lower, which has been helpful to equities.


The positive divergence in FXE/Euro Trust is continuing to be positive on the 1 min chart as I showed you last night, I'm still waiting for the market to settle, I don't care to trade in early morning trade.

Opening indications

As you know, I'm not very trustful of morning trade as it is largely retail traders who set limit orders and went off to work that are being fleeced in the morning hours, but the 1 min 3C chart opening has often been predicative of later action.

3C's 1 min underlying harts have all opened positive except for the DIA, which was one of the worst looking charts last night.

 DIA

 IWM

 QQQ

SPY

I'm not taking action yet, just waiting for the a.m. trade to settle.

Initial Trade Thoughts

The SPY looks set to open at or below the support of the flag, which if it moves below, could create the head fake catalyst for an upside reversal that I talked about last night, "the bounce".

I'll be watching 3C carefully, but if it plays out and looks like the bounce reversal could come of this, I will close the remaining short ETFS that I accumulated last Wednesday and sold part of on Friday. I may even open a very short term long trade using leveraged long ETFs like TQQQ, URTY, UDOW, UPRO.

These would be for what I see as likely a Bounce Only and I would be looking for an area of weakness to reinitiate my shorts at higher prices.

The possible long trades require you are nimble and able to close them out the same day if need be.

I won't make any moves until I see the underlying action, but this is what I'm thinking about as of now.

I'll keep you updated.