Last week we discussed what a downgrade of the triple A countres, especially France would do to the rating of the EFSF. I mentioned the EFSF has been trading or acting like a sub AAa entity for sometime now, that is probably traders discounting the inevitable. With France now downgraded a notch and being the second biggest guarantor of the EFSF, it only stood to reason the S&P would downgrade the EFSF soon, it was thought it would be several days, I suspect because they wanted to wait and see if any of the triple A rated countries would step in to fill France's shoes, something which would be very unpopular politically in any of the remaining EU AAa rated countries as many have already expressed dissatisfaction with their current level of involvement.
Well sure enough, t didn't take long, the S&P downgraded the EFSF
From the S&P:
- On Jan. 13, 2012, we lowered to 'AA+' the long-term sovereign credit ratings on two of the European Financial Stability Facility's (EFSF's) previously 'AAA' rated guarantor member states, France and Austria.
- The EFSF's obligations are no longer fully supported either by guarantees from EFSF members rated 'AAA' by Standard & Poor's, or by 'AAA' rated securities. We consider that credit enhancements sufficient to offset what we view as the reduced creditworthiness of guarantors are currently not in place.
- We are therefore lowering our long-term issuer credit rating on the EFSF to 'AA+' from 'AAA'. We are also affirming the 'A-1+' short-term rating on EFSF.
- The outlook is developing, which reflects that we could raise the EFSF's long-term rating to 'AAA' if we see that additional credit enhancements are put in place, but also the likelihood that we could lower the rating further if we conclude that the creditworthiness of the EFSF's members will likely be further reduced over the next two years.
Back at the ECB's deposit facility, well... do I have to say it? Once a trend is in motion it is very difficult to stop. The deposit facility has set a new record, as it has virtually every day since they conducted the Long Term Repo Operation (LTRO). The deposit facility now holds a record at $493 billion of .75% interest loans, but being all of the LTRO money and then some is in the facility, the banks are taking a -.25% loss just to lock their money up, safe from the financial system at an estimated cost to them of $1.6 billion a year (assuming it is LTRO money); that fact alone should sufficiently scream red flag. Keep in mind that around June of 2011 the ECB's deposit facility had less then $10 billion in their virtual vault.
To wit, the ECB is NOT happy with Euro-zone leaders, accusing them of watering down debt pact agreements reached just over a month ago by the majority of EU countries. The leaders on the Euro-zone have inserted escape clauses that n effect say, "These are the rules, but in case there's a significant economic down turn, then you get a pass". This is not what the ECB hoped for, but reality is reality, the debt reduction plans may reduce debt theoretically, but they increase unemployment tremendously and stagnate growth, it's a true catch 22.
The question now is how does the ECB react to this? Although we can't say for certain as we don't know why, but looking at Portugal's yields today hint at what exactly happens when the ECB refuses to step in to the secondary market and buy bonds (another catch 22 I wrote about yesterday).

This is the spread between Portuguese 10 year and Bunds, which is at an all time new record of nearly 1250 basis points, but the dramatic spike today is what s most notable. Has Portugal been thrown in with Greece as not worth spending money on to support their bonds or as I theorized yesterday, did Merkel's remarks scare the hell out of bond holders who are forbidden by their governing documents from holding paper rated below a certain threshold? It's hard to say, it may be both, but Portugal is now in big trouble in just a single day. The Merkel comments about putting in place a ban on selling bond due to their lack of credit worthiness had absolutely no positive aspect whatsoever, it frightens bond investors and when they get scared they sell.
Speaking of Greece, the S&P's head of sovereign ratings said today that he believes Greece will default shortly. The bond holder haircut negotiations are going no where fast and it looks as if the Troika will withhold the next tranche of aide needed desperately to pay maturing debt in March, I assume that is what he is referring to. This would be the first default of a developed economy in 65 years.
Here are a few interesting charts
This is the Dow-30 vs the NYSE index, the NYSE index has a lot of components so it is a good measure of what the majority of stocks are doing, it is in red. Clearly the NYSE is underperforming the Dow-30. This hints at a few things.
The Dow vs. The Russell 2000. The performance of the Russell 2000 going in to the Santa Claus Rally period is what tipped the scales for me and why I said I thought we would not see a Santa rally which we did not, the Russell should have been leading, the fact the Dow is leading points to a defensive market.
XLE/Energy which I have had a negative bias toward is peeling away from the Dow as is crude, which 3C has been negative on despite the geo-political events that alone, would normally have me very bullish on energy, but the market knows things we don't and 3C was hinting at that, so I stuck with the 3C readings and they are coming in to fruition now.
Look at Financial's underperformance vs. the DOW.

The S&P-500 clearly used the area in green to accumulate for the October rally, we knew this as 3C was getting very positive in to October, we even expected a new low (the head fake concept) before the rally kicked off and we saw that happen. However, the October rally which many thought would lead to new breakout highs and establish a new primary uptrend failed to do so. Since the October highs, which are the last really relevant technical move on the chart, the market over about 6 weeks has moved less then half of 1%. The environment we have seen since is really not good for institutional traders as far as outperforming the benchmark index, it is good for one thing though, setting up a big short position and given the Dow-30 has led, I suspect that is what has been happening. The Dow-30 contains the biggest stocks and for institutions to set up either a sale of a Dow component or a large short position, they need time and lots of it. Remember, they are not trading in 100/1000k blocks like we are, which will not move the market against out position, they are trading in positions so large that it takes time to fill them without significantly moving the market against them.

This recent wedge-like pattern is what I view to be the weak spot, it will probably be the epicenter of any change in trend. The recent breakout just above the wedge as well as the long term S&P H&S neckline sets up a potential head fake which is kind of a kick start or turbo boost for a trend change. Imagine longs buying the new breakout highs and then a downside reversal occurs, the further the market moves down, the more pan the longs are in and more longs are caught in that pain, which exacerbates selling which gives a boost to downside reversal.
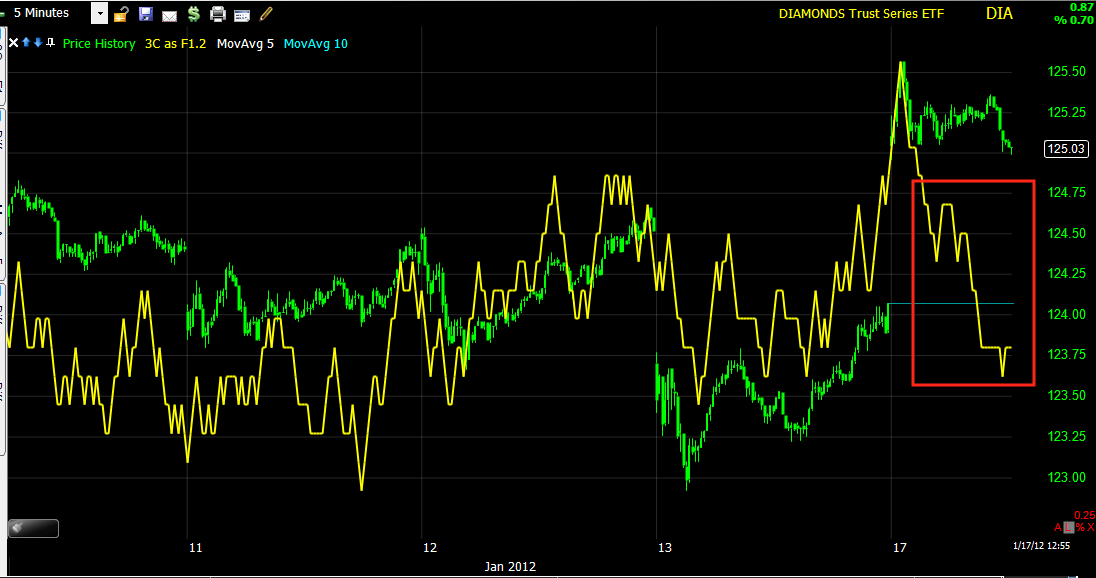
3C looks picture perfect for this to be a bearish wedge, it is literally going the opposite direction, a divergence so clear it need not be marked.
The Cumulative Volume Index also suggests this has not been a healthy move.
The NASDAQ Composite Advance/Decline line is showing major problems.
As is the NASDAQ 100, remember how AAPL looked like a major short squeeze, well AAPL's weight is enough to move the average without the majority of stocks.
And the Russell 2k is very bad as well, look how well the A/D line has held with the index until recently.
.




 | Theme by Thur


