Monday, February 6, 2012

Baltic Dry Index

This chart only goes back 5 years, but at 647, the BDI is posting 5 year lows and likely quite a bit longer then 5 year lows.

As far as I know, we were the first to uncover the trend in the usually noisy and volatile index, I didn't see it mentioned anywhere else until at least 10 days after we started seeing the decline and the trending nature which is exceptionally rare for this index.

Again, this is the daily rate published for the average cost of shipping dry goods on container ships, something that is not good for Greece as a major shipper. It is also a sign of economic activity in tangible goods (excludes natural gas, oil, etc) such as commodities like iron ore, cars, computers, textiles and just about anything that is shipped that is not wet.

Remember the Cat and Dogs trades I talked about earlier and the move in shippers of the last few days, both EXM and DHT mentioned as C&D trades earlier today are both at a profit and one of the bigger shippers, DRYS is up nearly 24% in the last 2 days.

Now we have news that shipping rates have gone negative.

Bloomberg reports:

Glencore Gets Free Ship With Fuel Discount as Rates Go Negative


Feb. 6 (Bloomberg) -- Glencore International Plc hired a commodity ship with the operator of the vessel earning nothing and contributing to some of the fuel costs after freight rates for hauling raw materials had their worst-ever start to a year.

Glencore chartered the vessel, operated by Global Maritime Investments Ltd., a Cyprus-based company with offices in London, at minus $2,000 a day for the first 60 days of the charter, Steve Rodley, GMI’s U.K. managing director, said by phone today. The shipment is Australian grains to Europe and it will put the ship in a better position for its next cargo, he said.

“Our other option was to stay in the Pacific and earn poor revenues or ballast to the Atlantic and pay the fuel ourselves,” Rodley said. Ballasting refers to sailing without a cargo.

The C&D trades in shippers are no coincidence.

Quick Market Update

 This is Friday's unusual close, I say that based on Dow Theory, although it is much more complex now then just Industrials and Transports, although on Friday I did point out the divergence between transports and Industrials and I will have more to say about transports in a post coming. However on this chart, you have to match up the color coding with the averages, the NASDAQ100, DOW-30 and SPX (yellow, light blue and green) all made a late day push, while the Russell 2000 and the Euro (red and white) failed to participate, this is a warning in Dow Theory.

Here is the Russell 2k's relative strength vs the SPX for the day, it fell off sharply at the close.

 Today is just killing time as I would expect as Greece will dominate this week's early trade, the SPY did hit the last late Friday support level which has acted as resistance thus far.

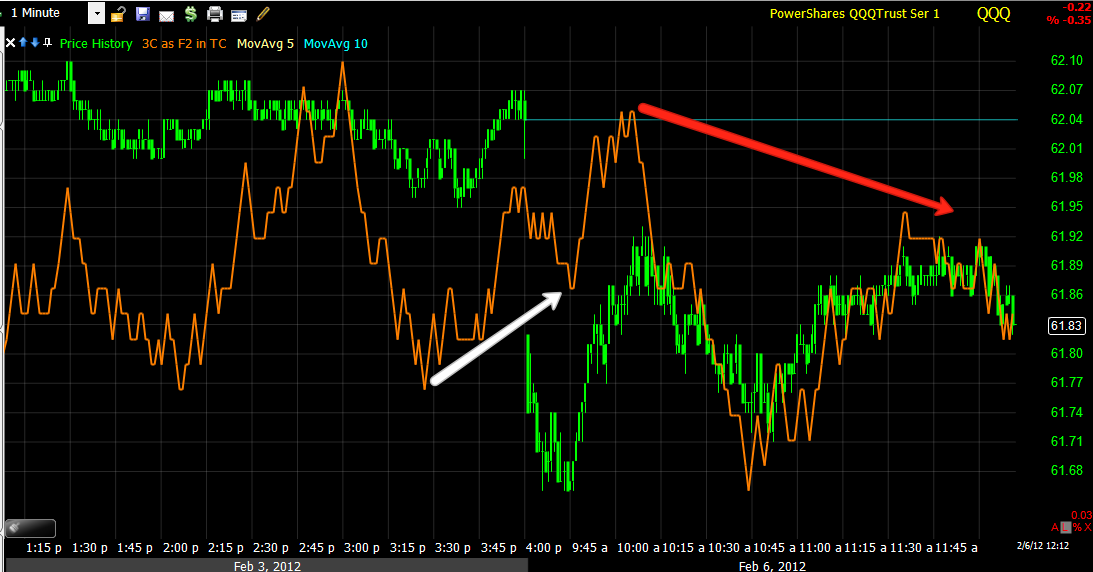
 This morning's 1 min 3C chart showed a small positive divergence and the SPY bounced off its lows, since hitting resistance for the second time, a negative divergence is in place.

The 5 min chart deteriorated pretty badly from Friday's afternoon highs and remains leading negative.

Swing Trade Template

This is my Swing Trade Template I've been working on for StockFinder. I have the basics of the signals completed, but still need to add some indicators and a possible market index/breadth indicator so you know when the timing is best for a potential swing trade. This basically shows you some entry points, what is important in the swing trend and what is just noise as well as exits.

I prefer using this on an intraday basis as far as entries/exits are concerned, there's no need to wait for the daily close when a swing pivot has been taken out as the entire concept is based on Swing pivots. Remember that Swing trades aren't meant to be long trending position trades, although you could certainly use this chart on a multi-day timeframe to define longer trends.

If you are running StockFinder as your charting platform and are interested, I can give you what I have so far or you can wait until I finish the template.

Here's an example chart to explain the concept of pivots and noise.

This is the daily Swing chart, you could even use this intraday for intraday trading, but as far as Swing trading, use the daily chart.

 From left to right, in Green we have our first Swing long entry, although you may have used other indicators to enter the trade earlier, this template is still helpful in identifying noise in the trend. Now we have a swing uptrend, the yellow arrow denotes the pivot candle, it is the last candle in the trend that makes the highest high. The white candles are noise, however once again, other indicators can be used to supplement and quantify the noise, whether it is just noise or whether it should be taken more seriously and stops tightened or partial profits taken. The next red arrow is the exit from the Swing Trend and if conditions are right, it is a swing short entry. This candle made a high lower then the pivot candle's low, thus we don't have to wait for a closing basis to execute the stop. Next we have a swing short trade, the yellow candle is the pivot, it made the lowest low in the series, therefore its high is what we want to watch. The first green candle made a low higher then the pivot candle's high and thus closes the swing trade and if conditions are right, opens a long swing trade. Next is the long swing candle pivot at the yellow arrow, it made the highest high of the series and its low is the stop. The white candles are noise within the trend, next we get a stop on the long swing trade at the next red arrow and a short swing trade which makes a long legged doji star, a hint that a reversal is coming. Two days later that short trade is stopped and a new long swing trade is in effect, again the yellow candle is the pivot and the red candle is the stop out.

Using this same layout on a 5-day chart can be helpful in trading WITH the trend. Some of the indicators I still have to add will identify the trend, but even the direction of a simple moving average can be used, the length depends on the timeframe you are trading.

Here the general trend is down, all of the same concepts apply, except this is on a 5-day chart, the idea is to only take the short trades as they are with the trend and to be out of this particular market when the trade ends and wait for the next set up. As you can see, there were 4 winning trades, 1 break even and 1 slight loss. Additional indicators and analysis can certainly improve your entries and exits, but if for no other reason, the template is valuable for understanding noise candles in white.

Email if you are interested in the layout.

IRE Update

Yes, the Irish Bank long trade, it's not a sub $3 stock, but may be a C&D trade although it does have a bigger base and looks to have enough support to trend higher. However being aware of the basic fundamentals in the Euro-zone right now is probably helpful in understanding this trade.

 IRE on Friday, which had the volume of a breakout day, but not the close, remember, pay attention to the close, that's when the pros are trading. IRE didn't close near the top of its range, which is not what we want to see on a breakout day.

 Thus far the Trend Channel on a daily setting is about the only trailing stop that is wide enough to hold the recent trend, allow for a correction and possibly higher prices, if you want to take profits or use a tighter stop, that's a matter of preference. I would think that the Greek meeting this weekend is what caused IRE from closing strongly as some profits were probably booked going in to an uncertain weekend. I have no idea what exposure IRE may have to Greek debt, but any Greek default will likely freeze the entire financial sector, so IRE may be responding to that uncertainty, if it were not for Friday being a breakout day and the situation in Greece, I would say this looks like a benign pullback. In any case, if you took the trade when it was mentioned, using the Trend Channel as a stop will keep you in at least a profitable trade as it is higher then the entry at roughly $6.50 and will continue to move up, the bottom of the channel is the stop for long positions. Usually I use it on a closing basis, but if you want to preserve profits, you can certainly use it on an intraday basis.


As far as a Swing Trade methodology, today's candle is considered noise within the trend, only a candle with a daily high that is lower then the pivot candle's (at the red arrow) low, would be considered a break of the Swing trend.

As for 3C...
 The hourly chart still looks very good, but remember, Greece is a big event, much bigger then Lehman.

 The 30 min chart is in perfect confirmation of the trend thus far.

 The 10 min chart shows a move from confirmation to some distribution on Friday.

Thus far the 1 min chart isn't telling us much about whether there's going to be accumulation on the pullback yet, it may just be a normal pullback, in which case the 10-22 day moving average would likely be targeted, this can be a correction in price or through time as the 10/22 day continue to rise.

I would keep an eye out for any headlines out of Greece, Germany or the Troika in general and if things get dicey, I would consider taking profits or at the minimum, tightening stops or a mix of both.

The CATS and DOGS Theory

I had my first major success with 3C back when I was only using it on daily charts, I can't recall the name of the company as it was a  long time ago, but it was sliding and 3C daily was soaring, I had published the idea on my free site, Trade-Guild.net and took some ribbing as it slid 20% or so, then it took off for a 400% gain. The next C&D trade came within days and that also made over 400% in about a week. It's not uncommon for C&D trades to pop 10-50% in a day, thus my partial profit taking "double digit gain" rule, especially if that gain comes in a day.

After having followed many of these trades, I've found that they are the kings of parabolic moves. Often a 50% pop in a day will turn in to a 300 or 400% gain over the next several days to a week. The thing they have in common is that they are cheap, some are liquid, some are illiquid, but they are usually under $3.00 or so. They also tend to fall back down just as fast as they rise, again, my rule for taking partial profits and keeping a trailing stop on the trade to allow for the possible 300% or more move.

Another thing they have in common is that they tend to be in beat up industry groups or they are the laggards of an industry group that has been doing well. They are pretty simple to understand, they are the coffee that is served at the end of the party, kind of letting everyone know politely that it's time to leave.

Wall Street is by no means ignorant of human emotion and habit, thus after a nice move in the market or in an particular industry group, the late comers want a piece of the action, however, they can't stomach to buy a stock that has appreciated 50 or 100%, especially when those stocks are the higher quality leaders that have share prices of $20 or more, so the human habit of bargain hunting takes over and the cheap stocks come in to focus. Wall Street knows this, why else would they be accumulating them? Then the stocks see a huge price move, the buyer feels they finally got in on the market action until the bottom falls out of the C&D stock they bought, it's almost like a boiler room operation. Wall Street makes the quick money, the retail buyer thinks that these amazing gains will hold because the market or the industry group has had such an amazing run. The gains don't hold, many of these trades will take off and be over in a week.

If you have the stomach and risk management for it and you have the aptitude to understand that the chances are VERY high that the gains WILL NOT hold and as such, neither should you, then these stocks can offer some very nice returns. It is no coincidence that they are showing up in shipping and so far this morning, I've seen quite a few already moving in cheap biotechs.

Remember though, even if you don't trade them, being aware of a slew of these C&D trades all of the sudden coming to life is also a warning signal, at least fro my experience in the past. In effect, coffee is being served and those who understand that when that happens, it's a subtle way of the host telling you the party is over, enjoy the coffee and leave. Those who don't understand that subtle hint will likely stay past their welcome.

EXM C&D Trade (long)

Here's another Cats and Dogs trade, also in shipping, EXM.

 I'm not quite sure if this would be a stage 2 breakout, but it would be a breakout nonetheless, RSI is positive here as well.

 As far as stops, there's a hammer that provides some support, which would be a deeper stop, or you can use a tighter stop at Thursday's lows (just below) as that was the pivot day. Again, you want to see a move through resistance on increasing volume, the bigger the better.

 The 3C 15 min chart, accumulation through the flat area on the daily.

And the more recent 2 min accumulation.

All the same concepts apply, these are speculative trades that can really move, but again, they tend to be a warning sign for the broad market which I will explain after I get the trade idea out.

Really, you can use any stop, even if you want to use something as tight as the entry on a closing basis, you are looking for the breakout move and subsequent follow through.

Quick C&D Trade -DHT (LONG)

The effect of the Cats and Dogs trades is an interesting phenomenon that I will explain later, but it looks like we are seeing it in the shippers and particularly the dry bulk shippers, yes the same ones represented by the Baltic Dry Index which has been plummeting. As for the C&D trades, they can move very quick, but profits should be taken pretty quick as well. I generally take at least partial profits on a double digit move and trail a stop, hopefully the move is being enough that you can take your original investment off the table and let the profits run guaranteeing a profitable trade. However the arrival of these trades, especially when they are working counter the market, is a warning signal, so be careful about managing them as well as risk. These are speculative trades by nature, so I would cut the risk management  rules (If you use a 2% rule, then make it 1%, etc), the way these trades can explode will make up for it.

 DHT looking to move to stage 2 mark up, this can be short in these C&D trades, volume should increase a lot on a real stage 2 breakout today.

 The daily 3C chart, a short accumulation period, but fairly strong, it should support the pop that these trades usually see.

 On a 5 min chart, we see the accumulation at the bottom, the first run and a pullback.

On a 2 min chart, it looks like accumulation of the pullback for the next run.

I have a new swing trade template that I'm still working on, but it is at least far enough to tell you what candle/day is in the trend, what is noise and what is a reversal. If you have StockFinder I can share it with you later today.

Will the Greek PM make good on his threat and resign tomorrow?

Sunday night talks (one of many moving deadlines) have failed to bring the Greek coalition government any closer to agreeing to the Troika's demand of more fiscal austerity, in fact two of the leading coalition parties, LAOS and the New Democracy have both said they will not support the cuts the Troika is demanding. Apparently tired of the Greek drama or what they call "dithering", the Troika has demanded an answer by 11 a.m.

It doesn't look good for Papademos, who threatened to resign on Monday if the Greek coalition did not come to an agreement that would satisfy the Troika. Will see if he keeps his word.

The words from the coalition partners will certainly test Papademos's credibility to keep his word, LAOS has said the country could not afford the cuts, which would cause a "revolution of misery which will then burn down Europe", while the ND said, they would not permit anymore austerity cuts.

The Euro has opened down in this week's opening trade and ES in overnight trade is close to testing Friday's intraday lows. It should be an exciting 12 hours in Europe.

 A 3C negative divergence on Friday's close, overnight trade has broken 3 intraday support levels thus far from Friday and is close to the intraday lows.

This is a 5 min chart of the EUR/USD with the Euro opening with a mild gap down, but recently in the last 15 minutes, downside momentum has picked up. I would guess that some very long meetings in Greece may not be going very well, we'll see if some headlines pop out in the next hour or so.

Tomorrow is light on the US financial reports, Thursday and Friday will be quite a bit heavier and we still have a slew of earnings this week.

George Friedman of Stratfor says, "Eurozone’s problem isn’t Greece or Italy: it’s Germany"

Stratfor is an unbiased source of Strategic Forecasting, George Friedman (if you haven't read Stratfor or any of his books, which I highly recommend) has a grasp on world political events that are simply beyond the scope of the world media.

To understand the crisis in Europe, one must understand the German dilemma and this free article by Friedman is a must read in understanding the dynamics shaping the Euro-zone crisis and the possible ramifications.

I would say the 5 minutes it takes to read this article are essential to understanding the fundamental issue for the Euro-zone, or in other words, it is a must read.

Drudge Report from Friday

When I have a chance, I stop by the DrudgeReport just to see what the round up of news events. Imagine my surprise that Drudge on Friday was covering the (at this point) controversial Friday Non-Farms Payroll data from the BLS.


 I clicked the link thinking I'd be redirected to Bloomberg or CNBC, but instead to my surprise, it was straight to ZeroHedge, which was pretty quick to whip out a calculator and show us some basic math as to how the BLS arrived at Friday's blow-out and highly suspicious number, especially given the number of Wall Street lay-offs for the period and the number of temp jobs that were ended, which were not reported in the BLS data. Well after about 4 stories covering the BLS data and the evolution of understanding how they came to such a number, which had, as Biderman of TrimTabs pointed out (who tracks daily tax receipts and thus has a much better feel for what the true employment situation is like and uses to phony gimmicks) its beat rooted solely in a arbitrary 'seasonal adjustment' which was to say the least, shocking, ZeroHedge has put together their conclusions with all the math and data from the BLS so you can check and re-check it as many times as need be.

Once you realize how they fudged the number and apparently have been fudging the numbers for over a year, tracking Gallup's or other polling companies employment reports starts to look at lot more reliable and tells a FAR different story, but as for the great work ZeroHedge has done, not rooted in speculation, but hard facts, here is their conclusion on Friday's beat, which had it not been for the arbitrary and poorly understood seasonal adjustment, would have seen the NFP miss, just as the PMI data, ADP data and other employment data indexes have been clearly showing (employment on the decline).

You may ask, 'what does it matter?', well if the NFP was something you followed, then it would stand to reason you might want to know the truth. It also would stand to reason that Wall Street has done their own math and discounting the data is what they do, so Friday's beat may very well be discounted by Wall Street in the very near future. If nothing else, it may serve as a wake up call as to how corrupt and inept our system is, one which in this case, should not be biased in an election year, but seemingly is.

While I don't agree with everything ZH puts out (it's clear they are biased), it's hard to argue with the numbers.