Today was an interesting day in many ways. First the AAPL head fake, it's not what I quite envisioned, but a head fake move it was and AAPL lost quite a bit of ground in an intraday only head fake. Wall Street has conditioned traders so well to "Buy the dip" and AAPL longs are so loyal that we still could see the bigger AAPL head fake breakout that I hope to see as a signal of a market reversal and to set up a new trade as I closed the AAPL Put from Friday in the WOWS Options Model Portfolio at a 15% gain for a day's trade, not bad overall, but still not exactly what I was looking for. I suppose the how doesn't matter as much as the result and that is the reversal.
As far as the liquidity addicted market, a few interesting things have happened over the last week. First the F_E_D conducted a reverse repo draining liquidity from the market last Wednesday and although they say it is not a policy change, it was kind of strange to see and I wonder how many more reverse repos are in the works.
As for ECB liquidity, LTRO has been an abysmal failure. To save face and make a bad ECB decision look like the banks's fault, ECB members were making noises about this being the last LTRO operations banks were becoming "too dependent on the ECB", so there goes ECB liquidity and who can blame them as the ECB's deposit facility soared to new highs today as ALL of the new liquidity from LTRO 1 and LTRO 2 plus an extra $35 billion went in to the ECB's deposit facility. It is reminiscent of the 0% treasury auctions or the negative yield auction by which banks are willing to take 0% or even pay just to get their money OUT of the financial system. The same is happening in Europe, I'll ask the rhetorical question, "Just what are these banks so afraid of?"Oh and of the 800 banks taking LTRO 2 money, 400 were German! What to make of that?
Speaking of liquidity, the Dallas F_E_D's Fisher was quoted today as saying,
Wall
Street has a "continued
preoccupation, bordering
upon fetish"
with QE3. "Trillions
of dollars are lying fallow, not being employed in the real economy. (Yes, the banks are getting them out of the financial system) Yet financial market operators keep looking and hoping for more. Why?
I think it may be because they have
become hooked on the monetary morphine we
provided when we performed massive reconstructive surgery, rescuing
the economy from the Financial Panic of 2008–09, and then kept the
medication in the financial bloodstream to ensure recovery....I
believe adding to the accommodative doses we have applied rather than
beginning to wean the patient might be the equivalent of medical
malpractice."
Does this explain the start of NY F_E_D reverse repos last week? One thing is certain, the longs who hope at EVERY F_E_D event or whenever any F_E_D president speaks, they will hear some hint of QE 3, today's Fisher comments were likely not welcomed by the buy the dip crowd.
The FT ran a story and Bloomberg published some numbers regarding the Greek PSI which comes due this Thursday at 3 p,m., the FT noted,
"A
large grouping of private creditors agreed on Monday to take part in
the multibillion-euro Greek debt swap in a significant step forward
for Athens as the country struggles to avert a sovereign default.
Twelve banks, insurers, asset managers and hedge funds in the
steering committee of bank lobby group the Institute of International
Finance said in a statement that they would take part in the bond
exchange. "
At first this sounds like a big win for Greece, after all, analysts wrongly assumed the IIF steering committee held 50% of the Greek bonds, according to Bloomberg:
"Private
Investors Holding About 20% of Greek Debt to Join Swap...The
12 members of the creditors’ steering committee that said today
they would join in the exchange have debt with a face value of about
40b euros ($53b), compared with the 206b euros of Greek bonds in
private hands, according to data compiled by Bloomberg from company
reports."
So apparently once again the analysts were wrong and 50% suddenly becomes 20% with 80% still unaccounted for-the PSI needs 75% participation as a precondition for the next Greek bailout or Germany will axe it. Thursday is shaping up to be a European "D" day -"D" for Debt and maybe decimation.
As for some individual Industries, as noted last week, copper looked like it was in trouble, COPX closed down today -3.6%
In case you were wondering what Dr. Copper is saying about the market, here's a look at the SPY in green vs COPX.
This is a similar divergence to the Dow-30 and Dow 20 (transport) if you are in to Dow Theory or pick any major average and compare to the Russell 2000 and remember the R2K should be the leader of risk on rallies.
SPY in green vs the R2K in white, note the last higher high the R2k made and that it is divergent with the SPX, again for those of you who follow Dow Theory.
Semi-Conductors were crushed today on volume, here's SMH vs the Q's
Not only is that a break of support, but look at the volume. With AAPL acting badly and semis too, I don't think the Q's will hold out much longer.
The internals keep getting worse, today's action came on lower
than avg. volume
(NYSE 700 mln, vs. 768 mln avg; Nasdaq 1636 mln, vs. 1692 mln
avg), with decliners
outpacing advancers
(NYSE 1223/1816; Nasdaq 1140/1370). We have watched Advancers/Decliners go from positive to less positive to about equal to negative to worse and all in about a week.
AAPL's decline today came on no apparent news, so it looks like the 3C negative divergences are taking effect.
If this is what a small intraday head fake that barely broke out can do on the downside, imagine what a closing head fake can do.
 Considering AAPL longs are not traders typically, but lovers of the stock and the "Buy the Dip " mentality Wall Street has brainwashed traders with as if it is impossible for the market to decline, AAPL could still see a daily closing head fake move and that would be truly destructive. I didn't see much in the way of accumulation today in AAPL on the "dip", but we'll be watching for it as a sign of an impending breakout/head fake move larger then today's.
As for other charts...
Here's commodities on a daily chart, look at that close with the long upper wick which is a rejection of higher prices and commodities never even made it up to the top channel, Commods are very close to breaking that channel.
Intraday commodities showed early "realtive" strength vs the SPX, but by the afternoon they were underperforming, thus the closing candle in the chart above this one.
This is part a risk asset divergence and partly trouble with China. Remember my FXP trade idea?
The idea was 3 days ago on a shakeout move below support, the trade is now up about 7% in the last 3.5 days. This is another version of a head fake, or shakeout and was a decent buying opportunity at low risk.
For almost a month now High Yield Credit has been selling off and divergent with the SPX, why do we follow credit? Because it is traded almost exclusively by the pros and as they say, "Credit leads. equities follow".
Intraday, High Yield sold off all day and didn't even participate in the end of day minor bounce.
The Euro/Market correlation has been waving red flags too, the divergence starting on the 29th and getting worse on the 1st led the market lower. Some people say the correlation doesn't work anymore, I think it works fine, they just can't comprehend how dislocated the EUR/USD is from equities and can't comprehend the fall in equities that would take place to revert to the mean,
Intraday there was a little outperformance by the Euro, short loved though and by the end of the day, the Euro/$USD wanted nothing to do with the market bounce.
High Yield Corporate Credit has seen the biggest 3 day sell-off since late November and is leading equities lower.
Here you ca see the divergence between credit in blue and the SPX, it was another red flag pointed out and led stocks lower.
Here's energy. Remember that channel buster in USO? That happened to be the same day in the red box in Energy, look at the rounding nature of trade and volume. I say Energy, Tech and Financials are the 3 pillars of the market, all 3 are starting to come undone.
This is Energy vs the SPX over the last several days, look at the divergences and yes, they have helped lead the market lower,
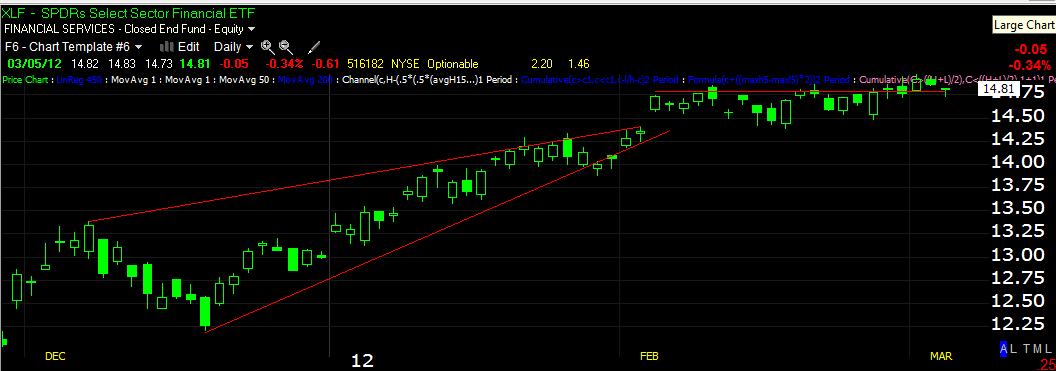
Financials saw a high volume churning day followed by a breakout of resistance, I'm willing to bet this is a head fake move that will lead financials much lower, we are already seeing it in individual names and the confirmation of a head fake move is just below that red trendline. I don't mean to suggest we can't or won't see volatility to the upside, we can, I just think the back is broken.
And unlike what you will see in Edwards and MgGee Technical Analysis, I have been pointing out for nearly a year that bearish and bullish wedges no longer break when they reach the apex, but rather trade sideways first, then they break. Sometimes we see a head fake like in SRS, but this is the new norm for these patterns.
Here's XLF vs the SPX over the last month or so, look at the trajectory of each, that's a nasty divergence.
Here's XLF intraday, it outperformed on a relative basis, but still closed in the red.
This is energy, , note the breakout (probable head fake) and absolutely ZERO follow through, today was very close if not a confirmation of the head fake move. Below the red trendline is the confirmation, I suspect it is right at the level as I would expect Energy to head much lower on confirmation and probably on larger volume like we saw intraday in AAPL or in GLD last week.
Energy intraday vs the SPX, it pretty much sold off all day.
Here are the E-minis (ES), look at the negative divergence in after hours sending ES lower, granted a lot can happen overnight, but this isn't a good start. If I recall correctly, we saw a negative divergence in ES toward the close as well and I can see a small one on the chart, so this AH negative is all the larger.
Look at ES and VWAP, it lost VWAP on the open and couldn't even get near it most of the day, it made it above later in the day and lost it again in after hours. This tells me market makers are having trouble filling orders at VWAP on market weakness, so much so they can't even manipulate the market intraday toward VWAP.
The only 1 dominant Price/Volume relationship was in the only major average to close green, the Russell 2000 at a +.15% gain! The P/V dominant relationship is price up/ volume down which also happens to be the most bearish relationship.
Sectors today... Financials on a relative basis vs the SPX held their own, Utilities pointed out the risk off nature of trade today. Basic Materials, Industrials and Tech all lost ground in to the close.
Finally TLT, I was asked quite a few questions tonight about my views on TLT...
Remember last Friday I said TLT was prepped for a pullback, if smart money wants to move to a risk off trade, TLT will be it even though treasuries are yielding next to nothing, it is still the safe haven trade and they would be likely to want to accumulate on a pullback (buy weakness).
Here is the 3C negative divergence on a 5 min chart from Friday showing the probability TLT would pullback today as it did.
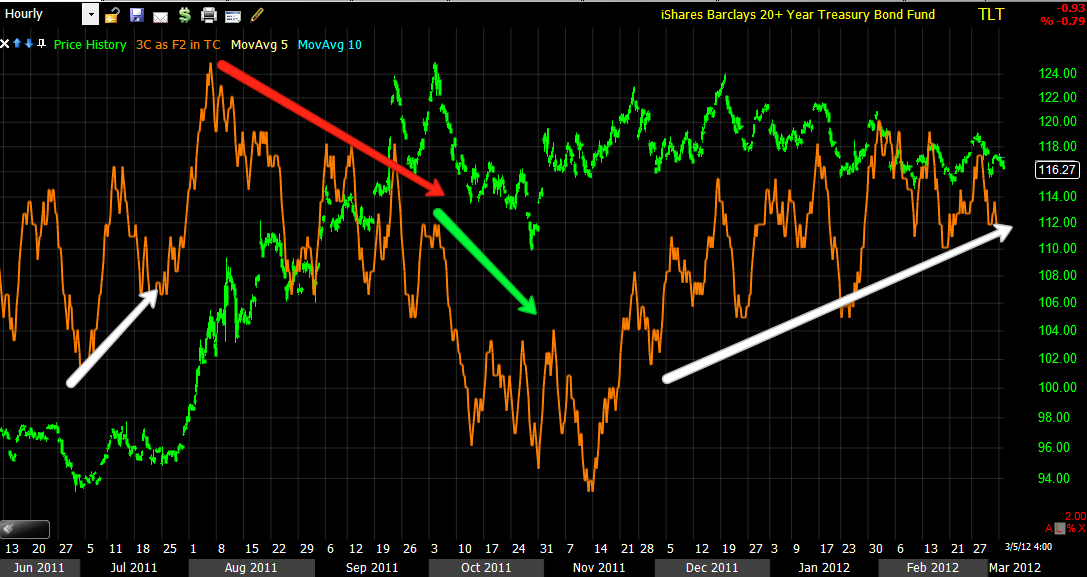
This is where TLT and Treasuries in general get interesting. They had a positive divergence sending them up higher and then went negative in 3C, 3C was in line on the decline and then around December it was if smart money just totally changed their mind and we saw a positive divergence form, this is the same time we have seen the market rally, a rally which I have consistently called a bear market rally, so if smart money is accumulating treasuries, then they are moving to a safe haven trade and they would have been doing it while the market was rallying. That's something to think about and in my meeting with the hedge fund manager tonight, we looked at this chart for more then a few minutes.
In our conversation, there wasn't a single issue we disagreed on. He trades way different then anything I've ever seen, to say he trades options would be an understatement, he teaches options for the CBOE! The modeling sytems they had (3 dimensional) were like nothing I've ever seen. In any case, his interest in this TLT chart was striking. His volatility analysis was, well lets say in line with my long term 3C analysis and I'm not talking about a single volatility indicator, I'm talking about a system I can't even begin to describe, very impressive to say the VERY least.






 | Theme by Thur