This has been an interesting weekend, last night I had dinner with a Wall Street veteran of 40 years, among other things ( there were so many I can't recall all), he was the head trader for Dreyfus with 300 traders below him. He's also a friend of the hedge fund manager I met last Monday and when he told (Jim) the HF manager we were going out for dinner, Jim came along too so it was an interesting night and I think will be beneficial for all of us. I consider myself a lifelong student of the market and to have exposure to people like this certainly gives me new ideas and concepts to explore. Furthermore, I don't think there's too much day light between our market views.
I also spent a good part of the weekend fleshing out a new 3C scan, here's a look at it, but please don't use any signals you may see as I still have a ton of work to do on it.

The idea is that I'm using a faster version of 3C (I'm still tweaking the code), it is actually different for each timeframe, of which there will ultimately be 5 (daily, 60 min, 15 min 5 min, and 2 min). When this is completed, it should scan a watchlist (this is the watchlist for stocks with weekly options) and when a stock like IBM lights up with 5 green lights, there will be a positive divergence on all timeframes (again, please don't use these signals yet as there is still a lot of work to be done). Divergences are easy to see, but extremely hard to scan for as your scan uses static settings, but a divergence can occur over a long period or short period, it can be a relative or and intense leading, so finding the happy medium is difficult, but I'm using a Linear Regression Slope of Indicator. The chart that is up is MCP, you can see the tabs above for each chart/timeframe (this is a 5 min timeframe) and you can see when the LN Regression slope is above Zero there's a positive 3C divergence at the first green arrow sending MCP higher, then the slope crosses below zero with a 3C negative divergence and MCP sees a sharp pullback, finally the slope crosses above again with a 3C positive divergence and the rest is history in MCP which had a great week on some fundamental news (you may recall the post from last Thursday). So this is looking for 3C divergences so I can scan the market and not have to look at 7,000 charts and find good candidates with multiple timeframe positive or negative divergences. I'm looking for 3C divergences, but using the Linear Regression Slope of Indicator to do it. As you can see, an example of what would be a great candidate (WHEN I'M DONE TWEAKING) would be IBM with 4 green lights, meaning 4 timeframes are positive. PLEASE DO NOT USE THIS SIGNAL AS I'M STILL FLESHING OUT THE TEMPLATE AND NEED TO BACK TEST IT.
Tonight lets start with ES (The S&P E-mini futures) and the EUR/USD.
This ES 4 Hour Bollinger Band chart is interesting (kudos Sam), as you can see price tends to bounce between the upper and lower bad, when price "Walks the bands" that is showing good momentum, you can see that at the yellow arrows. The recent arrow is not a good sign for ES as the bands are also looking at best, transitional.

Here's the ES daily BB chart, they say, "The Trend is your friend until the end when it starts to bend". The BB bands are clearly turning lateral from up and if you look at the white vertical lines I added, note how the bands are pinching, this is indicative of a directional move (this is the same thing I saw in AAPL last Sunday when I said I expected a head fake move, but the BB's were so tight, I didn't know how AAPL could hold out long enough to get a solid daily closing head fake-sure enough there was a head fake move Monday morning and AAPL was sent 2.2% lower, again, it was the tight intraday Bollinger Bands predicting a highly directional move and soon, a 2-2% decline for AAPL is pretty direction for the intraday timeframe the bands were pinching on). So again, we are seeing some negative action in the BB's with a highly directional move likely shortly.

Here's a 4 hour ES chart of 3C showing the recent rally, it looks nearly exactly the same as most of the major averages and industry groups, the divergence is so sharp I didn't think I needed to annote the chart.
This is an ES 5 min 3C chart from the end of last week, note the volume Thursday.
And a 1 min ES 3C chart with a steep leading negative divergence in a flat area of trade where we commonly see smart money at work. The yellow arrow shows were ES opened tonight for the new week.
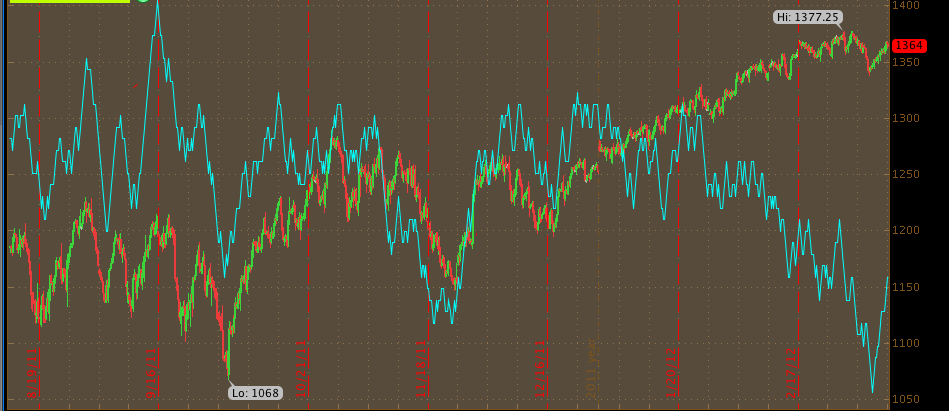
While all relevant markets in the CONTEXT Model are not open, the model is significantly lower then ES as of the 8:15 update, which suggests ES is trading rich or above the model's implied value.
Currency...
A 5 min chart of the EUR/USD late last week, remember I pointed out how it was very strange that commodities and stocks were bouncing while the Euro was falling apart (there's usually a solid correlation between the market and Euro).
Here's the long term daily chart of the Euro in a primary down trend, I have pointed this chart out before, and how I thought the Euro was headed for new lows at the bottom of the channel, this would mean a stronger dollar and that is not good for stocks or commodities.
Here's the Euro/USD open tonight with the Euro losing some ground early on.
Tomorrow is a light day on the US economic calendar, Tuesday is a bit busier with an F_O_M_C meeting announcement at 2:15 p.m. It should be interesting as the WSJ floated the idea of a sterilized QE3, which unlike QE1/2 would add no liquidity to the market, but it would help the treasury sell bonds as China has really pulled back on buying US Debt. Who knows what we get, but remember as I always warn before these meetings, "Beware the knee jerk reaction", I can't remember the last time we didn't have one and then a reversal of that; it usually takes a few days for the market to sort out its opinion and for funds to get positioned, although it wasn't so pronounced last time as the announcement was a real sleeper.
In over the weekend news, as we speculated when seeing how poorly commodities were performing and later confirmed by manufacturing data, China is in trouble. Saturday China reported their biggest trade deficit since 1989 and they still have the housing collapse and inflation concerns. Keep an eye on FXP which I updated several times last week-the last time on Friday as it has pulled back as expected.
The trigger of CDS (in essence insurance policies against a Greek default) came last week, so the EU financial sector is going to be interesting, as a matter of fact the entire financial sector, but mostly the EU as we see who has the reserves to pay the insurance payout that has now come due. Friday we already heard about an Austrian bank that was short a few billion dollars, I'd expect to hear more similar announcements, so we'll be watching financials carefully this week for potential opportunities.
News also broke that Greece may be about $107 billion dollars more BROKE then previously thought. This is a new $107 billion that to date has not been included in Greek sovereign debt and it is all guaranteed debt, by who? Greece. I'll be digging in to this story more as the mainstream financial press starts to dissect this new revelation, I do wonder if the Troika was aware of this and if they weren't, what it means for the Greek Bailout that is still not finalized, actually far from it.
We also have another US Aircraft carrier, The Enterprise now steaming for the Arabian Sea... I won't speculate, but that would put 3 US aircraft carriers on station just off Iran's coast...
As of right now, US futures are down about .25%+, as usual though, a lot can happen overnight on the EU open.




 | Theme by Thur