Wednesday, March 21, 2012

The Dow to Retest Support?

 Th DIA saw a positive divergence at support earlier as we saw the large volume spike typical of a reversal, now it looks as if it will be heading down to test the area again.

 DJ-30

ES saw the same small positive divergence at the same time, it has just started leading negative, so it looks similar to the Dow here.

BAC Bank of America

Poor Paulson- considered one of the best managers out there, he had BAC as a top 5 holding in 2011 with something like 124 million shares, the fund lost -55% for 2011 and he sold BAC right around the bottom at the $5 area just to see it come thundering back, his other top 5 holding was GLD which was his only profitable top 5 holding which he had to sell to meet redemption requests.

I have to say, this isn't one of my favorite stocks, although I've used Calls and Puts for quick 1 day trades and have done well from 10-55% in a day.

Something seems to be going on with BAC, it looks a bit transitional here.

 While my gut tells me before too much longer BAC will be under $7.50 again, I have to respect the chart which shows a stage  1 base and stage 2 mark up, this is probably one of the best examples of the 4 stages, BAC topped in 2010 (Stage 3) and then through 2011 was in a stage 4 decline, the whole process started over with a stage 1 base seen above and stage 2 mark up since the breakout.


 Here on a daily chart we see what looks like a distribution day with a long upper wick on the candle and heavy volume, that day has acted as resistance since and of course the move is a bit too parabolic for my liking.

 On a 60 min chart there's a triangle, this would be assumed by technical traders to be a bullish continuation pattern, volume is right for it, but did we just see a head fake move this morning in yellow? You know how Wall Street likes to take technical traders to the cleaners and this is a very obvious pattern in a widely watched stock.


 The daily Bollinger Bands show in green a healthy walking of the upper band, however when they have popped outside the band, they have seen a pullback, we have 5 days now outside the BB's.

 On an hourly chart volatility is squeezing suggesting a highly directional move, the question is whether it's a head fake move and BAC pulls back, which should be a substantial correction or not, I tend to think BAC will pullback, but how it gets there is the question.

 My Trend Channel has held the recent move up perfectly, although it did stop out recently at the red trendline/arrow and the channel has been lateral since 960 min). The ATR is also decreasing and the "Close within range " indicator at the bottom is biased toward the negative.


 Here's the daily 3C chart showing the stage 1 base accumulation, then confirmation at the green arrow and now a negative divergence, it' not a huge negative, but enough for a decent size pullback.

 Here the 30 min chart has gone leading negative in a flat area of trade, which is where we commonly see distribution.

The 15 min chart shows the same

 The 2 min chart is leading negative in to that flat area, it looks worse then the longer charts because the shorter timeframes flow in to the longer ones.

 Here's a wider view of the 2 min, note the negative divergences sending BAC lower and the leading negative since at least the 19th. There is a small positive divergence now, today at the white box, again, this could be part of a head fake move as it is very small compared to the longer trend.

The 1 min chart shows a negative divergence on the open sending BAC lower and has been in line since.

Right now BAC is just above the triangle at $9.90, keep an eye out for a head fake move and a move in BAC below the triangle, at $9.50 the had fake would be pretty well confirmed. If that move came today, it would also create a very bearish engulfing pattern on the daily chart, highly suggesting a reversal/pullback.

I favor options on BAC as they can really move and fast, but even a straight short should be profitable if longs get trapped in a head fake move

MArket / QQQ / AAPL Update

 Here's the DIA test of support, note the down trend, the bullish candle and high volume, this is almost always an intraday reversal, it doesn't mean much more then a reversal, there's no way to judge if it is short lived or lasts hours, but we see this often and often it is a reversal intraday.

 There's a small positive DIA 2 min divergence. IF the DIA fails here without much of a bounce, it will most certainly trip a lot of stops and create strong downward volatility.

 The QQQ's are the last to start the rolling over process, even the IWM and SPY have begun it, the DIA is just the furthest along. As you can see there are some negative divergences in the QQQ short term 1 min.

 Also a leading negative in the 2 min,

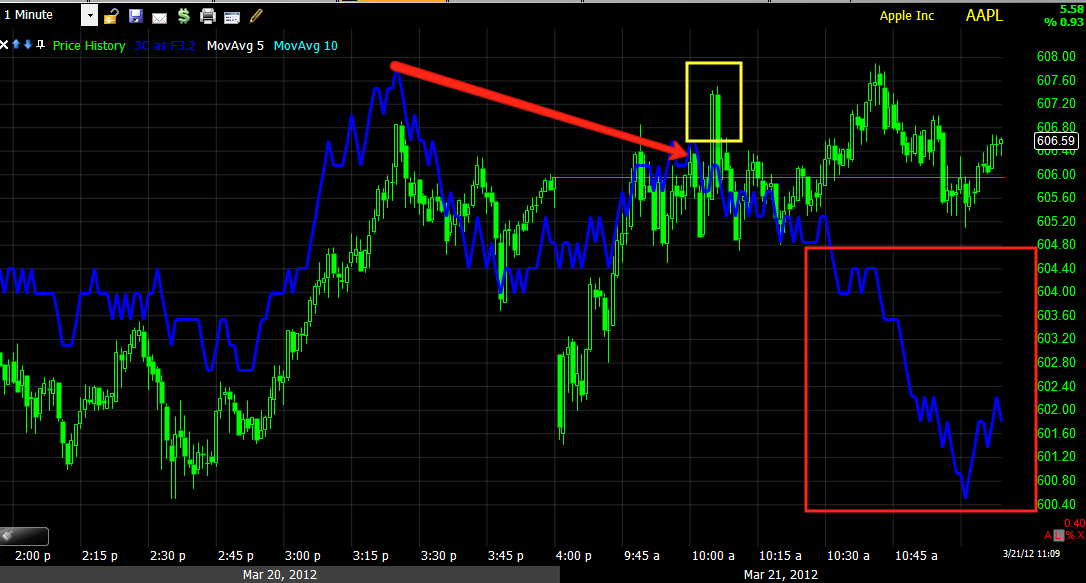
 AAPL put in a sort of Tweezer top yesterday (yellow), it was slightly exceeded, but still seemed to act as resistance as AAPL moved back below, AAPL is the key to the Q's and is leading negative on this 1 min chart.


 Also the 2 min chart.

 There's a relative negative divergence on the 5 min AAPL chart

 the same on the 15 min chart

 And even worse on the 30 min.

The 60 min has refused to confirm prices in AAPL since the 19th short term.

We'll see what the Dow does and whether the averages start to diverge.

The Dow

Thus far the Dow is the worst performer on the day, but it is also the closest to testing important support.

 A longer view of the Dow rounding over, the Dow is furthest along in this rolling over.
A closer view of the support area coming up...

EIA Crude Inventories

Just released at 10:30...


Released On 3/21/2012 10:30:00 AM For wk3/16, 2012
PriorActual
Crude oil inventories (weekly change)1.8 M barrels-1.2 M barrels
Gasoline (weekly change)-1.4 M barrels-1.2 M barrels
Distillates (weekly change)-4.7 M barrels1.8 M barrels


We have a draw in Crude of 1.2m barrels

Dept of Energy reports that:
  • Crude oil inventories had a draw of 1.16 mln (consensus is a build of 2.2 mln)
  • Gasoline inventories had a draw of 1.2 mln (consensus is a draw of 2.0 mln)
  • Distillate inventories had a build of 1.76 mln (consensus is a draw of 1.5 mln)
  • Change in refinery utilization at -0.5%.

Maybe more importantly, here is the trend...


[Chart]

USO's reaction is muted


CAT Follow Up

Yesterday I featured CAT as a way of looking at the change in large cap performance, although yesterday small, mid and large caps all under-performed.

Some people like the idea, so here's some more on CAT

 I prefer wide stops on initial trade entries, they can be tightened later when the trade is moving in your favor. I see a small gap just above and above that is a resistance level, my initial stop would be above that resistance level although I don't think it is a very high probability of it being hit.

 The trend channel has held the entire uptrend without a hiccup, you can see where the stop out was to the left (red arrow) and as usual, there's some further gains but usually not worth the volatility as we are back below the stop out level. Th Channel's stop is close to the stop I like above, so I'd consider that as confirmation. It would be nice to enter the trade on some strength in a gap fill, but...


by the looks of this 15 min chart which went leading negative throughout yesterday, the chances of even that don't look great. You may want to consider phasing in to the trade, maybe 50% here and add if there's a little strength. Otherwise, add as usual to a trade that is moving in your favor on a correction.

Model Portfolio Trade

I'm going with GDXJ April $25 Calls. I just wanted to see GDXJ cross $25 first.

GLD and Miners

As the S&P seems to pick up where it left off late yesterday...


Yesterday's GLD long idea is doing pretty well thus far in early trade.

 Here is the correlation between GLD and GDX
 And between GLD and GDXJ

GDXJ-Junior Gold Miners

GDXJ looks pretty good here for a long swing trade...

 This isn't a major descending wedge, so I doubt the normal wedge rules of a lateral base will apply, I would think the wedge target price probably applies, "Wedges retrace their base", so maybe a swing move to the $29-$30 area...

 Here's a very tight intraday stop. If the trade gets moving, this will need to be widened.


 The 30 min chart, you can see the last negative divergence at the same time we had the GLD head fake +215% trade.

 The 15 min is positive as well

 The 5 min is positive too.

Right now, the 1 min is in line with price or trend confirmation.

I may open a position here in the options model portfolio

Currency, overnight ES and China

 In EDT time zone, ES saw a positive divergence around 8 p.m. and a negative divergence around 11 pm. Since capturing this screen shot ES has slipped a little more and for the time being the trend is in line suggesting that it continue to move down until the next divergence.


 This move is almost perfectly correlated with the start of a move higher in the EUR/USD above and the AUD/USD (carry trade) below.
AUD/USD

Here's a closer look at both...
 EUR/USD

AUD/USD

It appears concerns over China during the Asian session caused the slip in the currencies and thereby
ES futures, the AUD/USD would be expected to react more pronounced being Australia's trade with China and we see that in the pair.

ES continues to slip from $1402.50 at the start of writing this to currently $1401.75

Of course Europe opens in 45 mins so a lot can still happen overnight, but I thought it would be interesting to point out the effect the currency pairs have on the market futures.