Monday, April 23, 2012

UNG Update

I have long suspected something is going on with Natural gas, long before this news of Egypt cutting off the Nat. Gas supply to Israel, which is another interesting macro story we'll have to get in to when there's more time.

Take a look at UNG,
 The volume alone suggests there's some kind of churning going on as UNG has broken multiple levels of support.

 A bearish descending wedge, the break below these two support areas was around the time Bernie was testifying before Congress when a congressional member (during the Superbowl of economic events being watched by everyone in finance) asked Bernie a rhetorical question about Nat. Gas, which was an obvious plug as Bernie has nothing to do with setting energy policy. The question was so out of place it was an obvious plant and if you remember, UNG rallied right after that with a positive divergence the day before-Congressional inside trading!

 Some recent volume in UNG, today it is moving up on the news from Egypt, but either that news was well known some time ago, or as I suspect, something more fundamental is going on with Nat. Gas. I just read an interview over the weekend with a large hedge fund manager, he was moving aggressively in to Nat Gas. All of the stop loss orders being hit would give these hedge funds easy shares on the cheap.

 The 1-day Trend Channel is showing what would be a short term trend change if it closes above the $15.30 level.

 UNG 60 min shows a strong leading positive divergence in to lower prices, remember this is what 3C is supposed to do, contradict price to show what smart money is doing and buying low is what smart money needs to do. The length of the divergence suggests this is about more than just the Egyptian news from yesterday, this divergence stretches back to March and the daily even longer. MArch also happens to be where an obvious support level was broken, stops would be triggered and smart money can easily accumulate without giving away their position as someone has to take the other side of the trade.


 The 30 min has a sharp leading positive right in the area of the 19th/20th, this I do not doubt was inside information on the Egyptian action, those decisions aren't made on a whim.

 The 15 min chart shows the same strong divergence in the same area, I have little doubt this was a leak of the Egyptian news.

The 2 min chart would be more along the lines of Specialists on the NYSE accumulating in expectation of a near term move higher, again, the news was probably well known on Wall Street late last week.

We'll see how UNG reacts to the upcoming EIA report, but long term I suspect there is an accumulation process going on here that is reminiscent of the accumulation of home builders during the 2000 tech meltdown-who would have thought in 2000 housing would lead the next bull market?

Wall Street.

To put it more succinctly, I wouldn't be surprised to hear within a year or so of a major policy change in Energy, the political situation in the MENA area (as I mentioned above, we'll have to address that) is likely a catalyst as everything we predicted about Egypt WHILE Mubarak was still in office, has come true.


Market Update

 DIA 1 min

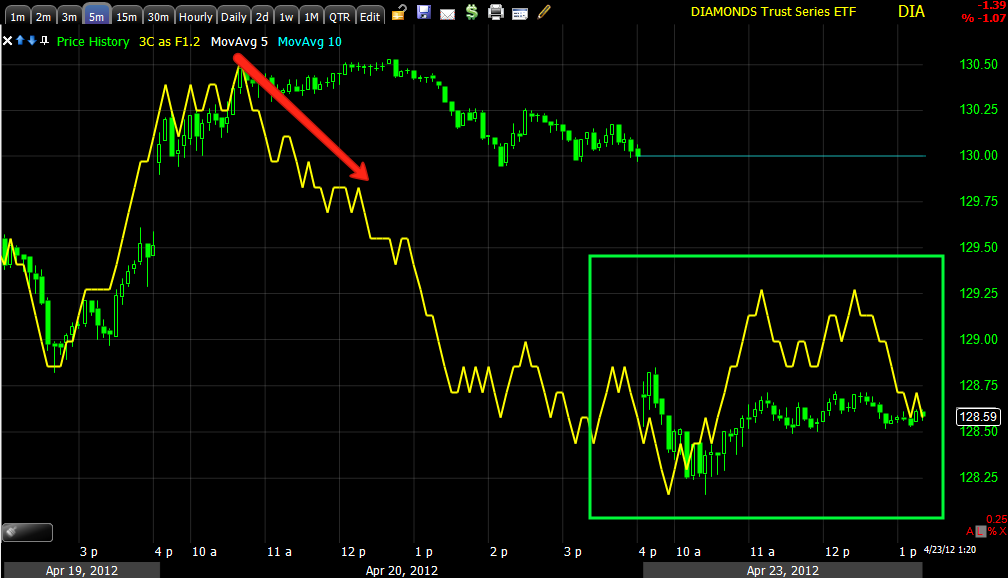
 DIA 5 min-The Dow doesn't look to have the strongest underlying action, but one thing it is doing with the rest of the market today is managing to stay lateral, this is where we most often see divergence. IT is also not leading negative and showing strong distribution. It appears to me by the 1 min charts that there is some likely accumulation going on with the market intraday being knocked down a bit as it gets too high or too far away from the accumulation zone which would be at the lows or as close as they can get to the lows.

 QQQ 2 min, Tech still shows the best underlying action, this is a carry over from late Friday.

 Interestingly, the 5 min chart has had more then enough time to confirm the move lower, it hasn't, this is a sign of some underlying strength in the Q's

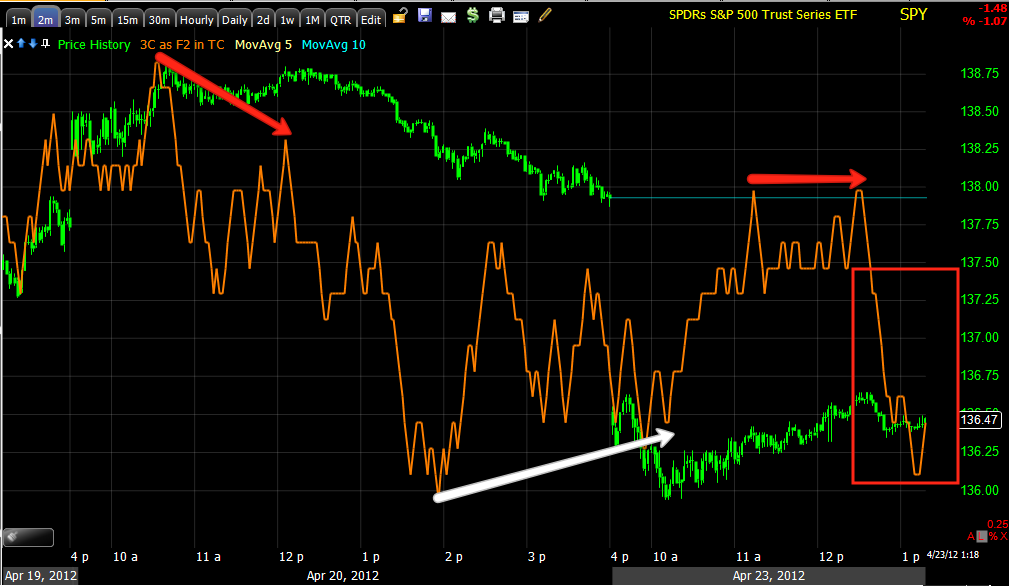
 The SPY, again seems to be knocked down and sees a positive divergence on the pullback lows, it appears there's an effort to keep the market relatively flat and stable and it also appears there's some accumulation going on here.

SPY 2 min is seeing a decent leading positive divergence.

I'll try to look at the 3 main sector with an emphasis on tech.

ES Update

ES is a bit higher than where I pointed out earlier, this is not a leading positive divergence, but on the other hand, it is not showing any extreme weakness here, taken with the risk asset update and the CONTEXT model, I would say there's upside potential here.

GDXJ Update

I'm liking the junior miners (GDXJ) better than GDX at this point. I'm close to considering some calls in GDXJ for a very short term trade based on the volatility shakeout concept. A break above $21.90 would probably clinch the trade for me, but it is only worthwhile using calls. This should certainly be considered a speculative trade.

 AS GDXJ pulled back, as we wanted to see, 3C is looking better here on the 1 min.

 The same with the 2 min

All of the smaller intraday 1-2 min divergences are accumulating on the 5 min chart which is leading positive, this is what I was hoping to see and why I would consider a long Call GDXJ position -probably May expiration and slightly in the money.

Risk Asset Layout

There are a few interesting developments on these chart.


 First commodities (brown) vs the SPX (green) and the $USD (blue). Note as the dollar weakness as it usually does after the EU close commodities are showing better relative strength, pretty much an arbitrage trade, than the SPX, there's room for the SPX to move higher based on the dollar weakness, commodities are taking advantage of that more than equities, but most of that is in Energy. There's a chance the SPX is being kept a bit lower than the arbitrage correlation for accumulation at lower prices, but that will have to be verified in the next market update.


 Longer term, don't get excited about the SPX, commodities are way out of line on this 60 min chart, again a lot of this is Chinese manufacturing weakness, but that will effect the US markets, especially with today's data showing Germany falling behind.

 I don't know why the CONTEXT ES model is showing such a short timeframe, but the model is higher than ES, suggesting ES has room to move higher.

 While this isn't a screaming positive divergence, High Yield Credit is holding up reasonably well, pretty much still in Friday's range, this is a slight positive in the very near term for the SPX again in green as always.

 Longer term of course there has been huge de leveraging in HY Credit as it hasn't made a higher high since Feb. 6th, "Credit Leads, Equities Follow". The odd thing is the Credit markets want to have nothing to do with a risk on move that Equities had been involved in and HY Credit is an extremely cheap way for mart money to play a risk on move, so the signal since Feb. 6th has been quite accurate as we watch the SPX weakness unfold.


 Yields near term were negative on Friday, they tend to pull stocks toward them, we expected to see the divergence in any market strength in any case, I suspect even if there is a 1 or 2 day risk on bounce, Yields will continue to negatively diverge. There's some slight weakness in Yields intraday.

 The $AUD which has been an excellent leading indicator for the market is almost in perfect sync with the SPX intraday.

 On a 15 min chart, there are several negative divergences in $AUD depicted in red bringing the market lower as carry trades are closed out, however there is some slight positive bias at the white arrow between the SPX and $AUD. I do not think this is indicative of the carry trade being restored, but it may be enough support for the market to continue a few more days  with volatile chop.

 Longer term, $AUD shows a huge negative divergence starting just before the SPX started to top, there should be some reversion to the mean as the SPX breaks down when considering the bigger picture beyond intraday and day to day moves.

 The Euro is also nearly in perfect sync with the SPX intraday.

 Again, there's a longer term negative divergence in the correlation, but near term (and I wouldn't go betting the farm on the SPX as a long), but the Euro does have a relative positive divergence between the two yellow trendlines with the PX.

 The Yen is doing exactly what it should intraday for the most part, the SPX is actually a little stronger here than it should be vs the Yen believe it or not.


 The rise in the Yen is a clear indication of carry trades being closed out, this is a market negative. Whether the BOJ intervenes in the currency or not is anyone's guess, but their interventions have not been effective in the past.

 High Yield Corp. Credit shows a negative divergence right about the time the SPX turned down from the intraday high, Credit here intraday is a bit weaker, but this all changes very quickly.

 Mid term on a 15 min chart, you can see the negative divergence and sell-off in Corp. Credit leading the SPX lower, there is an interesting divergence though in place in the white box where Credit is actually holding up better.

 Longer term, game over. Credit is in a clear down trend, however as pointed out above, tight now, it is holding up better than equities, which is a market positive in the near term, note the relative areas at the white trendlines.

 Financial momentum vs the SPX was horrible Friday, it was very strong earlier today and gave out a little recently, but all in all, this is a slight positive for the market near term.

 Energy looked bad on Friday too, early today it was leading, it has since given up some momentum, at least as of this capture, but still remains supportive.

 Tech was a mess Friday, it is leading just as all of the tech stocks and the QQQ updates have shown, this appears to be where any market strength is coming from, Financials and Energy are helping, but as we saw on Friday, it appeared Tech wants to rotate in.

 Sector rotation since Friday... Energy is the obvious outlier in terms of strength, the Defensive sectors picked up as they should.

In afternoon trade, financials (at least as of this capture) were losing some momentum, the Defensive sectors were also losing momentum, indicative of some risk appetite here? Note Tech especially gaining ground late in the day.

ES Update

To the left you see the chart of ES I showed you earlier as it seems reports of government budget failures and resignations in the EU seem to have been leaked as 3C on ES was deeply leading negative at least an hour before price even started moving down. On the New York open we have a relative positive divergence between about 5:30 a.m. and the opening lows in ES (a relative divergence is not as strong as a leading divergence such as we see to the left in red). For ES to put in a strong positive intraday divergence from here, price would need to near (assuming it continues moving up) the $1362 level and 3C (light blue) would need to be above the white trendline. That would give us some positive divergence, otherwise there's not much of a current indication here.


Quick Miners Update-GDX/J

As I kind of suspected, as GDX and GDXJ move lower they are both seeing the 1 min chart improve, this would be buying weakness. This just pretty much started as they have moved a bit lower and it has not shown up on the 2 min chart yet, but it is certainly worth keeping an eye on.


 GDX

GDXJ still appears to be the stronger of the 2

Market / AAPL Update

 The DIA intraday 1 min has gone from an earlier positive divergence to a negative divergence as it reached the intraday highs, the movement in 3C down after the negative divergence looks pretty sharp. I'm not making any calls based on this activity yet. I'm going to try to get up an S&P-E mini (ES) update next and then a Risk Asset Update.


 The 5 min DIA is largely in line with price action right now.

 The 1 min QQQ also saw the same early positive divergence and a negative in to the highs, it may be like I suspect with GDX, that because of today's gap down on the perfect storm in the Eu, they may have to lower their average position size if they still intend on creating a bounce, as noted before, this is a very ugly market, but we have expected this to get ugly and more volatile. We still have AAPL earnings tomorrow and the F_O_M_C Wednesday.

 As mentioned in the earlier update and as was apparent late Friday, the Tech Sector and NASDAQ 100/QQQ have looked the strongest of all of the averages in underlying trade, thus the 2 min chart here is still in leading positive territory.

 The SPY did the same as all the other averages, a relative negative divergence at the intraday highs, what is curious is the depth of the move down in 3C after the negative divergence.

 The 5 min chart is at least in line, and slightly leading positive still.

 Interestingly on the intraday 1 min, AAPL saw the same divergences at the same time.

 The 2 min is still not horrible looking, but agin, the move down in 3C after the negative divergence is curious.

 The 5 min chart has not seen the weakness of the 1 min bleed through yet and remains leading positive.

Please though, lets not forget what the bigger picture in AAPL looks like on the 60 min chart, a very deep leading negative divergence. Thus while there may be opportunities for leveraged, quick trades in AAPL taking advantage of the market's volatility, I personally want to start moving away from those trades (at least in smaller size) and be looking toward building an equity short position.

GDX / GDXJ Update

This is from Friday's original idea looking for a break in GDX which came today. As mentioned in today's earlier update I was looking for GDX/J to pullback a bit and show continued accumulation before entering a short term long position on a volatility shakeout move.

Here's how it is progressing so far...

 As of Friday we were looking for a break in GDX below $46, this would serve as a potential head fake shakeout move, but it must be confirmed that the shakeout is being accumulated before entering. If you are not familiar with this trade idea, make sure you see this morning's update and the link in that update to Friday's initial idea.

 GDX is rounding over, this is what I wanted to see from this morning's update, however I am not seeing the strong 3C positive divergence that needs to be there for this trade to be worth taking a shot at, it may be GDX is still too high and it may see a positive divergence at a lower level near the white box.

 You can see the 1 min chart turned GDX around with a negative divergence.

The same holds true for GDXJ, but to a lesser extent, it does look like the stronger of the two. As of now I would continue to be patient and see if we can get a strong positive divergence on an intraday pullback here.