Friday, July 27, 2012

BIDU Update

I cleared out of BIDU long positions expecting a pullback, however initially as the BIDU trade was setting up, my original expectations were for BIDU to make a counter trend move up that "could" be larger than what we already have. BIDU was entered once as a short and is still at a 15% profit as a core short on a bull trap, this latest move was a bear trap. The question in trade over the coming days will be whether BIDU actually does have more counter trend upside or whether the primary trend is about to re-assert itself (or some other variation).

The charts... (and what a great example of using market manipulation to your favor-both trades successful and both on head fake moves)

 We stalked BIDU, even before it broke out in the yellow box, we knew that was the highest probability and that is also where we wanted to short BIDU-YES IN TO  A BREAKOUT! Since then, BIDU has headed down in what I believe is a primary bear trend, however when we saw this bearish triangle setting up just as it should according to Technical Analysis, we saw something positive in 3C and knew this was a bear trap and BIDU became a short term long trade, even though I kept the core short (hedged with longs), this trade was worth it. Traders expected BIDU to follow the red arrows to a new trend lower, instead it sucked them in on a positive divergence on a break lower and then broke higher causing them to cover and sending BIDU higher. I still think there's a good chance BIDU could continue higher, but I do think it will pullback before it goes much higher and how it act in that pullback will tell us a lot about the future of any further upside gains.

 As for the long term trend (the core short position), look at the daily chart of BIDU from late 2008 where it was heavily accumulated and then sold in small pieces in to strength, the 2011 top was bad with a leading neg. divergence, the 2012 top even worse as 3C is now lower than it was when BIDU was trading at $10 in 2009.

 The 4 hour chart showing the neg. divergence and where we shorted BIDU (in yellow), but also a recent positive where the bearish price pattern was, a bear trap.

 Recently the 1 min chart has gone deeply negative

 And the 2 min

 The 3 min shows the last accumulation area as BIDU squeezed shorts and that is now going negative

 The 5 min chart showing the same, also pretty negative.

It looks like the highest near term probabilities are a move to the downside, how BIDU and 3C react during such a move will tell us more about the near future.


The 15 min chart shows the bearish price area forming, the break below and the accumulation of all those short and the confirmation of the move higher, we'll have to see how this chart reacts as well.


Filling Out FAZ Equity Long

This is not an options trade, but rather a long in the equites only model portfolio, I may be a bit early, I may be right on time, but I'm going to go ahead and fill out the FAZ position in the longer term portfolio.

I'll be the first to admit this slight break of support is not much of a typical head fake move, but technician's almost always use the exact support resistance level. It's a little bit of a gamble, but this isn't using options and I have always been much more patient when it's a straight equity trade rather than an options trade.


 The 1 min was progressing along nicely and then jumped to a leading local high.

 The 2 min chart's trend overall is in line with the trend expectation.


 The 5 min chart has a nice long positive relative divergence, in fact its actually leading, I drew it in as relative just because I was marking a relative position from earlier in the week.

And the hourly is why I have more patience with this, this is an overall leading positive divergence on a long chart in a big area.

Intraday TICK Chart


Dislocation

 The loss of today's entire gain or 120 PIPS IN 45 MINUTES!

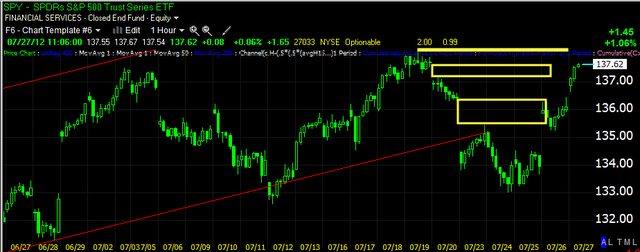
The SPY in green vs the Euro in red, note where they are in relation to the open.

Update

The Euro is taking the ECB rebuttal of an un-sourced rumor worse than the market at this point, remember the Euro and the market have a pretty tight correlation and any move higher in the dollar hurts the market.

Based on the 3C charts of the Euro last night, I said my gut feeling was we gap higher today, I also said the only question was "when will the move be faded?", early or later in the day? It seems it is being faded or set up for that right now as the currencies that support the market are not helping out.

 The 1, 2 and this 3 min chart (that's pretty fast migration of a negative divergence) are all leading negative on the ECB's comments that the "Rumor" was actually nothing more than run of the mill-PEOPLE-THINK ABOUT WHERE THE SPY IS, WHAT ORDERS WOULD BE TRIGGERED, THE TIMING OF THESE NON-SENSICAL RUMORS! Do you really think this is all just coincidence?

The proxy for the $USD intraday was already in a positive position, it is even more positive in a leading position after the ECB comment.

UVXY Call Position Opened

I chose to split the 1/2 size Options model portfolio position like this, of the 50%, 20% went to September $7 Calls and 30% went to August $7 Calls. I may be getting a little too fancy for my britches there, but I wanted a longer dated position in case I decide I want to sit through a correction.

I'll look to add the rest either on a signal I just can't pass up or after the weekend passes and the rumors are dealt with (of course the rumors could also be along the lines of this morning's German Central Bank shooting down Draghi's comments)-two sides of the coin.

Going to Open 1/2 UVXY Call position

I'll probably look at August $7.00, but I'm only opening half as there's plenty of time over the weekend to put out more unsourced rumors, but with the 1-15 min various market charts in the position they are in and a parabolic spike, I think 1/2 a position is not too crazy.

Follow up

From today's post regarding targets for the SPY published here on Tuesday,

More Rumors and we hit Target 2-GLD may not be agreeing


The following chart and commentary are from the post linked above....

"The 3 SPY targets posted Tuesday of this week, we are at the second, the 3rd would be a break above recent highs which would not be all that unusual as head fake moves are seen about 4/5 times before a major reversal, that's why that specific target was added."

And now our current daily chart...

All 3 targets posted on Tuesday for the SPY have been hit, make sure to check out the bold from the chart and post above.

The $140 area would be a real solid head fake move, but I don't get the feeling we are headed there, especially as the news that the last would be rumor to take out all stops was just shot down by the ECB itself-the stops are still taken out.

Another Rumor Just broke

When you see this, you can almost be sure there's some news, in this case an unsourced rumor...

That's all this market is running on now, rumors.

The rumor:

From Bloomberg


  • DRAGHI SAID TO SPEAK TO WEIDMANN BEFORE AUG. 2 COUNCIL MEETING
  • DRAGHI SAID TO FAVOR GIVING ESM BANKING LICENSE IN LONGER TERM
  • DRAGHI'S PROPOSAL SAID TO INCLUDE BOND BUYS, RATE CUT, NEW LTRO

Now the denial... This is why we don't chase


An ECB spokeswoman said in an e-mailed statement that it is usual practice and nothing special that Draghi meets or talks with the members of the Governing Council. She declined to comment on the content of any talks.

FB Update

The 1, 2, 3, and 5 min charts are turning to a negative intraday divergence in FB and some other stocks and averages as well. The 15  min and up haven't changed. Perhaps FB will do some base building in the area? It's too early to say, but I just wanted short term traders to know about those divergences.