Wednesday, August 22, 2012

USO looks like a decent short here

Maybe a phased in position, an add to, etc. I always have a little feeling of caution when trading oil because of the fundamental risks, but after the EIA report and the charts, I like USO short in this area.

I'll follow up with some charts, you may want to consider a phased in approach in case we get higher prices later today after the F_O_M_C at 2 pm EDT.

I already have a PUT position and a full size short in the equities model portfolio.

Charts coming...

GLD Update

GLD is actually up today +0.21% and so are the Sept. $160 puts added yesterday-I suppose it's a volatility issue.

In any case, here's the GLD update.

 There are many different price patterns traders could be following, but the recent triangle is almost certainly a visible formation with yesterday's breakout, As gold has been acting as a QE sentiment indicator, and as the hopes of QE for this year fade, I've wanted to get short GLD on strength, here it is. We may have volatility today with the F_O_M_C_ minutes at 2 p.m., or it could be a catalyst for GLD, either way, I base my decisions on what I can observe, not what I can make arbitrary assumptions about.


 For short term moves, the hourly Trend Channel (which is one of the first indicators I won an award for) is showing a stop area around $158.50, needless to say, I'd like to see that broken soon.

 The 10 min Bollinger bands are tightening, it does appear GLD will make a directional move shortly, although watch out for the initial volatility, it could very well be a head fake move.

 On the 1 min 3C chart, note the intraday triangle and remember that head fakes occur on al timeframes, o we could see an upside breakout followed by a downside reversal, 3C is not even close to confirming price on this chart, it gets worse though.


 Here's the 1 min trend, not even close.

 This is where GLD gets really ugly, the 2 min chart has a lot of nice divergences that worked very well, but look at the current one, remember I've been talking about extreme divergences the last couple of days, here's one.


 On the 3 min, here's another, so we have migration confirmation of the divergence.

 Even on the 5 min, so there's good confirmation, this doesn't look like a mistake or false signal.

The 30 min chart will not confirm.

And the 60 min chart which amazingly has provided some very short term trading signals for us, is leading negative.

FB Positions

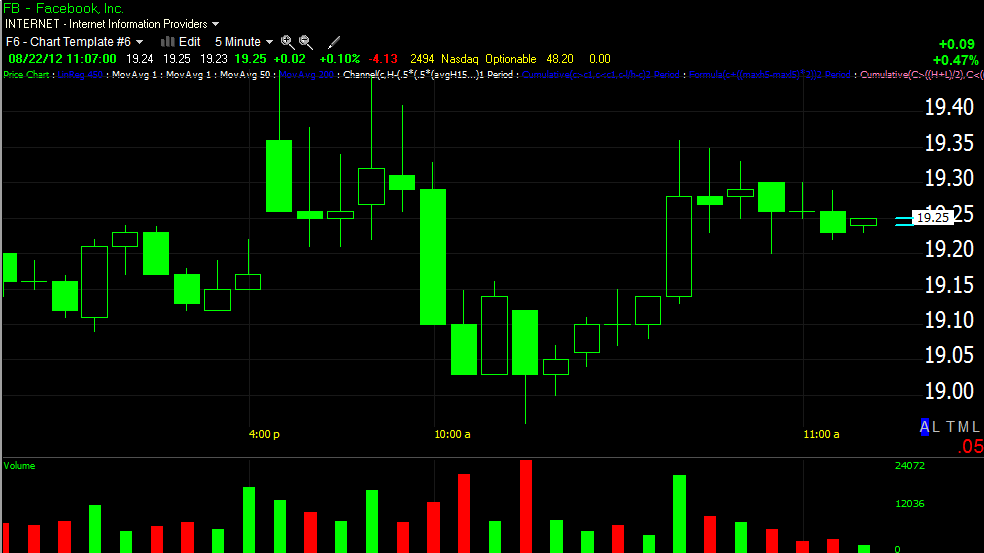
As mentioned in the last post, I filled out the FB position to what is a normal position size for me, I also added FB September $19 Calls in the options model portfolio, this is more of a speculative size position.


Filling Out FB Long

I'm going to go ahead and fill out the FB long today, actually as soon as I can and may even consider a Call position in the options model portfolio. FB is one of the few stocks that doesn't seem to draft the market, at least that's our experience on the last long position that went very well.

When we first noticed something bullish going on in FB again a few of us took some short term trades, but I had suspected that they'd be short term and FB would pullback to make a bigger base, something that will sustain a bigger move, that seems to be what is happening and I like what I see in this area.

 On the daily we have a double bottom or "W" formation, over the years I've noticed that double bottoms do not do what Technical Analysis books say they should, which is to make a shallower second bottom, instead they make a deeper second bottom making the base look like a failure and setting up a bullish head fake move as well.

 Intraday today, seems to be nothing going on right?

 Apparently there is something going on, the 2 min chart looks like decent accumulation in to price weakness.

 As does the 3 min

 And the 5 min

And longer term, the important 15 min chart is at new all time highs for FB.

And on that, I'll fill out the Equity long ad may look at some calls.

AAPL, an Exodus coming?

Two simple charts, a 1 min and a 5 min, the 1 min is more immediate, the 5 min is more powerful as to the underlying theme of trade. It appears to me a narrow doorway is being opened as it seems a large group of hedge funds may be looking to lower their risk profile and AAPL is where much of it is congregated. Then how they open the door...

 The AAPL 1min chart, door being opened...

 Severe damage on the AAPL 5 min chart, number of institutional traders looking to exit said door.

Now the mechanics of opening a door like this... Volatility.

 VXX 1 min volatility with a negative divergence, not huge, but it should bring volatility down in the near term intraday.


 2 min chart confirming after a bog move in strength.

Ultimately the problem with trying to fix too many at the same time through 1 door, the 5 min strength in volatility. Things could get really ugly in AAPL quickly once the door starts to shut and everyone tries to get out at the same time, a kind of stampede.

Opening Indications

As I first mentioned yesterday in my "Gut Feeling" post which is just based on market behavior/trader psychology to keep an eye out for a bounce that can be used to short in to at better price levels as the longer timeframe charts deteriorated badly yesterday, pretty much locking in some serious damage, thus making shorting strength easier as the damage done is severe.

This morning the market seems to be following that line of thinking, AAPL will be particularly interesting as there are a lot of hedge funds holding it and only 1 door out, you know what happens when too many people try to fit through 1 door so I'll be watching AAPL carefully today as well as movements in volatility. For now, the market...

 DIA 2 min has made a higher high, I was wondering about this one yesterday . However keep in mind this is only a 2 min chart, the damage done in the longer timeframes yesterday appears to me that we are at the reversal now, that doesn't mean we won't see the same typical market volatility and games, so I want to use this to my advantage.


 IWM 3 min carry over from yesterday and a bit better today with a positive divergence, yet within a leading negative position, this is sort of what I mean about short term strength is almost a gift here as longer term deterioration is the dominant theme.

 QQQ 2 min carry over from yesterday as well.

SPY 2 min carry over from yesterday, it seems my gut feeling was right, but anyone paying attention to market dynamics the last several months could have made the same guess easily.

Next a look at AAPL and what may be the building exodus.

Overnight and in to the open

Overnight we start with the Japanese Trade Balance which was a disaster in both import and exports, exports fell the most in over a year to levels seen around 2009. As a result, the JPY was crushed especially in the AUD/JPY carry trade pair, which is not good for the market. This alone was partially or largely to blame for S&P Futures falling overnight (ES). This has also, in a light macro news environment, caused most of European markets to fall in to the red. Spain's IBEX is down over 2%, the biggest drop in 3 weeks now, even with a short selling ban in effect. The Spanish Bond market is in worse shape, perhaps there's some reversion to the mean, if so, the IBEX would be due to lose another 7%.


Juncker's visit to Greece today should provide a lot of rumors and spin, many countries coming out in advance against softening of conditions for Greek aid as Greece falls way behind targets they are supposed to have achieved, mainly the Netherlands is speaking out today, but we saw Germany and others yesterday. Whether Greece asks for concessions today will be interesting and potentially market moving.


Much is being made this morning of New Jersey Unemployment which saw it's largest move since June of 2009, causing many analysts to wonder whether this is just NJ or a sign of things to come at the national level as NJ has long been considered Employment friendly.

As for the MBA Purchase Applications, a mixed bag.
Released On 8/22/2012 7:00:00 AM For wk8/17, 2012
PriorActual
Composite Index - W/W Change-4.5 %-7.4 %
Purchase Index - W/W Change-2.0 %0.9 %
Refinance Index - W/W Change-5.0 %-9.0 %
New applications picked up after running flat for the last several months, while refinancing saw a precipitous drop. The F_O_M_C minutes will be scrutinized over Housing.

Just released (10 a.m.) Existing Home Sales may add some color...

Released On 8/22/2012 10:00:00 AM For Jul, 2012
PriorConsensusConsensus RangeActual
Existing Home Sales - Level - SAAR4.37 M4.500 M4.300 M to 4.650 M4.47 M
Existing Home Sales - M/M Change-5.4 %2.3 %
Existing Home Sales - Yr/Yr Change4.5 %10.4 %


Existing home sales fell a surprising 5.4 percent in June to a 4.37 million annual rate which was the lowest of the year. Declines appeared for both single-family homes and condos and declines swept all regions. But prices were higher, at least the median for this series which is up a strong 5.0 percent from May for a year-on-year plus 7.9 percent. The median price, at $189,400, was the highest in 2 years. June's weak sales total raised supply on the market to 6.6 months at the current sales rate from 6.4 months.

We do have 2 key events today as mentioned, Juncker's trip to Athens and the F_O_M_C minutes released at 2 pm EDT. After Lockhardts very hawkish comments and stance against further F_E_D easing from yesterday, the F_O_M_C minutes will be key for many market participants.

Remember what I said yesterday about the pullback/bounce scenario in my "Gut Feeling" post, there may be some typical F_E_D knee jerk reactions at 2 pm as is almost always the case, be careful not to be too rash on the initial release.

Opening indications coming ....

Tuesday, August 21, 2012

Volatility

Not only traditional volatility, but the strength in the 3C signals is getting really impressive. Take a look at VXX (Short Term VIX Futures), it seems someone is making a big bet on increased volatility, which means the market goes the other way.

 This is our typical leading positive divergence in VXX on the 2 min chart.

 The area above is highlighted as the 13th, note the huge move in the leading positive divergence now.

 Here's a 3 min positive divergence.

 Here's the same period from above to the left (8th-13th) and look at the leading positive now.

 A typical 5 min positive divergence...

The same 5 min positive to the left (13th) vs today's super leading positive divergence. I might even consider adding some Calls to UVXY if we get a pullback.

The 3 Pillars and AAPL

Here are the 3 most influential "Risk/Rally-on" Industry groups (Financials, Energy and Technology) as well as the fulcrum stock of the market, AAPL.

This seems to give evidence to a small bounce as this rally has been intact long enough that its habitual, people are use to it, they won't give up on it that easy and are more likely than not, apt to see this as a "Buy the Dip" opportunity as not much is down by more than half a percent any way, especially the AAPL die-hard longs. Technically today is a big mess.

AAPL
 A 1 minute positive divergence, this is the fastest timeframe (except for Tick) and as such, the least influential, signals here are generally intraday, although the trend of this timeframe can be very useful. In any case it looks like there was some accumulation on a small scale in AAPL at the lows, this could be retail alone.

 Anchoring the negative character of the action in AAPL today is the 5 min chart, which doesn't sound that much longer than 1 min, but it is much more influential, as you can see, the move in to intraday highs was sold hard by institutional money, this can include short selling.

 The 15 min chart also is not only at a strong relative negative divergence this a.m., but also a steep leading negative divergence that started as AAPL ran to intraday highs.

The question in my mind is whether they run AAPL/the market up a bit as my initial gut feeling suggested as that would give traders some confirmation and more would enter the market OR if they just caught some more longs in the fly paper today and will just drop the hammer tomorrow on the open? As you can see, stops were hit around 11 a.m., but then there was some buying at the lows and again right at the 50 bar 5 min moving average-that's almost certainly retail.


 Energy 1 min fell off hard the last few days, I feel really good about the USO short/Puts.

 Energy 3 min, it's not coincidence that 3C deteriorates as badly as it does just as Energy breaks above resistance and 3C continues to deteriorate in a flat trading range.

 Energy's 30 min chart has transitioned clearly from price/trend confirmation to distribution.


Financials
 Financials saw a huge move in 3C on the 1 min chart today even among an already negative trend, this is a really extreme move.

 The 3 min chart did the same in to the last week, but it has been progressively worse the last few days.

 Locking in the downside, the 30 min chart is heading for new lows as XLF hit new highs, the spread on the divergence is huge and on a VERY important timeframe.

Technology
 Here's where it gets interesting, the 2 min chart just fell completely apart, I mentioned this yesterday about the strength of some of these 3C moves, today's was no exception.

 At the 3 min chart there's a positive leading divergence in Tech, that fits with AAPL pretty well. I've always said AAPL would be the stock to watch.

 Locking in the downside in Tech, the 5 min chart has gone from bad to worse to something almost indescribable. A lot of damage was done today, but it's the trend of distribution that really speaks.

Look at the movement in the 15 min chart in several days, all the way to a new leading low well past anything on the chart.

Thus, if we have any price strength, ti will be temporary and I'd use it to short anything I still want to get in to, I don't think they'll be much if any time to do this.


Might have found it

I might have found some evidence for the gut feeling I posted the last 2 posts, just as the Q's were showing something, there's something in Tech and AAPL, but on the other side of the coin, both are anchored down by worse divergences on longer timeframes, so for me, this is a very safe area to sell short in to price strength.

Charts coming.