Tuesday, October 9, 2012

Short Term AAPL Close / Long Term FCT Close

I was hoping AAPL would close the daily candle with a bullish reversal hammer on increasing volume, a very reliable reversal set up, AAPL did exactly that.


Today's closing candle a bullish Hammer with increasing volume, this is a very high probability upside reversal signal.

Also AAPL has some affinity for support along the 100 daily e.m.a., we saw AAPL find some support there today.

Longer term, FCT has been a reliable leading indicator for the market, typically on a larger scale of weeks to a month or more of divergence vs the SPX, however this is a shorter term divergence and has bearish implications for the big picture in the market, yet another reason I want to sell or short in to price strength as the big picture increasingly looks like the market has a downside move of some magnitude coming.

 FCT,  a leading indicator, clearly has broken down through the June low rally uptrend.

This is a negative divergence with the SPX which has not as of yet, since FCT tends to lead, the expectation is the SPX will follow, however as mentioned above, this tends to be a little longer divergence signal than just a few days, so a move higher in the market or bounce, is completely within the normal behavior.


Market Update/Leading Indicators

DO I love this market today? Do I feel strongly that is has added to the positive divergences from yesterday? No. I actually am pretty disappointed we didn't get a stronger pullback/consolidation to briefly send prices higher to short in to.

There was some confusion apparently among the algo's today that sent the Euro lower, it had to do with conversion rates of Spanish Yields. When Citi Analysts asked the Question, "Why did the Euro fall overnight?", they came back with a glitch

So why did the Euro fall? The best answer seems to be that the 10yr Spanish benchmark has changed from 5.85% Jan 2022 to the 4.8% Jan 24As a result some systems been showing the wrong Bund/Bono spread and players spooked when the "old" spread moved out by more than 30bps. 

There's also AA earnings tonight, the market has good reason to be nervous about earnings at these multiples.

In any case, the forward looking indicators...
 Commodity divergences with the SPX tend to lead the market

 As do divergences with High Yield Credit, positive vs the SPX.

The $AUD is also an excellent leading indicator as seen above, it's also positive in here, but this isn't an easy case to make.

AA will probably have more to do with the market than any indicator out there.

AAPL Calls sold

Today's $630 calls were a decent little trade, but more exposure than I wanted in AAPL long so while there was a decent profit for the day and AAPL is losing some ground, I figured now is as good a time as any to lighten the exposure load to AAPL long, yesterday's Calls remain, doing much better now than earlier today at half the loss.

 A quick 22% gain today in the calls was worth it, I'd love to hold them for more upside, but I decided any long in AAPL was going to sty at a reasonable size and adding today's position to yesterday's was getting beyond the level of risk I'd be willing to tolerate.


 AAPL 3 min -you can see the intraday negative divergence after 3 pm that is sending AAPL lower right now intraday.

 The 10 min chart still looks pretty good with a higher leading high that yesterday even though prices are lower.

What I'd really like to see though is some bullish reversal candle like a hammer which is still in place now with the increased volume, this tends to work very effectively for reversals (to the upside-allowing yesterday's calls to make money and setting up a short at a better level).

Selling today's AAPL $630 Calls

Charts to follow

Market Update

 The DIA 5 min still doesn't look good.

 The 10 min does look much better than yesterday, still there's no overall large scale accumulation so the original ideas about watching the market in a declining situation and see if there were to be large positive divergences signaling institutional money was buying in on price weakness and QE 3, is just not there.

 IWM since the downside reversal, the 3 min chart is above yesterday's range.

 As is the 5 min chart, still we aren't seeing large accumulation areas or periods, I suspect any price strength will be short lived.

 QQQ 5 min is in yesterday's range which is good considering the trade today.

 As is the 10 min chart.

 SPY 5 min since the downside reversal is also moving to a new leading high above anything from yesterday

 Here's a closer look

The 10 min chart is doing the same.


RIMM Update

RIMM is one of those stocks in which it falls in to the "Beaten up stocks looks better" rather than the "High flyers are looking worse" in a strange stock picker's market that I suspect has a lot to do with something the market hasn't been concerned about in many years, value. Look how AAPL and RIMM are trading almost exactly the opposite, even today.

My feelings on RIMM have been longer term positive as it builds a base and shorter term pullback before it can break out, I even wrote that yesterday and here we are today.

Lets see how it's progressing...

 On a 5 day chart the price ROC has dropped off dramatically, changes in character precede changes in trend, volume has also been looking better recently.

 On a daily chart, here's the base area I mentioned, it just looks too extended to me for a break out from yesterday' close, today a nearly 5% pullback.


 The 60 min 3C trend with confirmation on the trend down and a leading positive divergence at the flat base-like area.

 A close up of the 15 min chart shows exactly the negative divergence that suggested RIMM pullback, even though price alone made that look like a high probability.

We like to buy pullbacks as price comes to us, we get a better price with less risk, but it has to look ready, it has to show accumulation of the pullback.

 The 2 min chart shows the very early 3C timeframes are starting to show some progress in the pullback, STARTING.

At 3 min it is still in line and 5 min as well as 15 min is still negative, the 5 and 15 min charts need to see positive 3C divergence migration and then we'll know it's high probability that smart money is accumulating in that area, that's where we want to look at buying.

Definitely a long worth keeping an eye on though.

AAPL comeback

From down -2.29% to +.20% in the green today, the daily candle is shaping up for the volatility shakeout of the shorts mentioned earlier today. Yesterday's option position is looking much better, but still red, today's is 20% in the green.

 The daily candle thus far is a bullish hammer reversal candle and volume will be above yesterday's making this a high probability reversal spot.

The 60 min chart that shows most of the pattern, from negative at the head and leading negative coming off the head to a relative positive divergnece, this looks like the right area for a volatility shakeout of the shorts, some already probably hit today.

FB Update

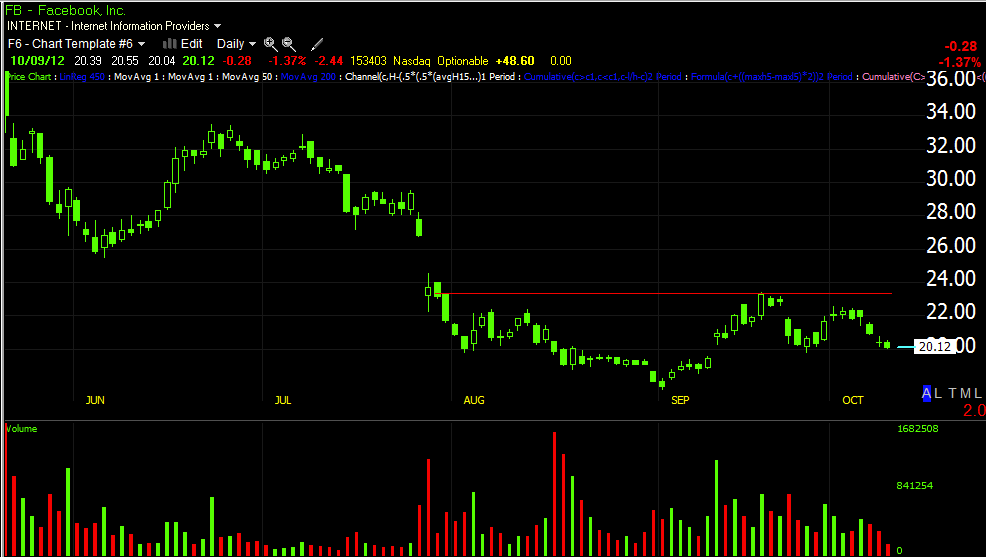
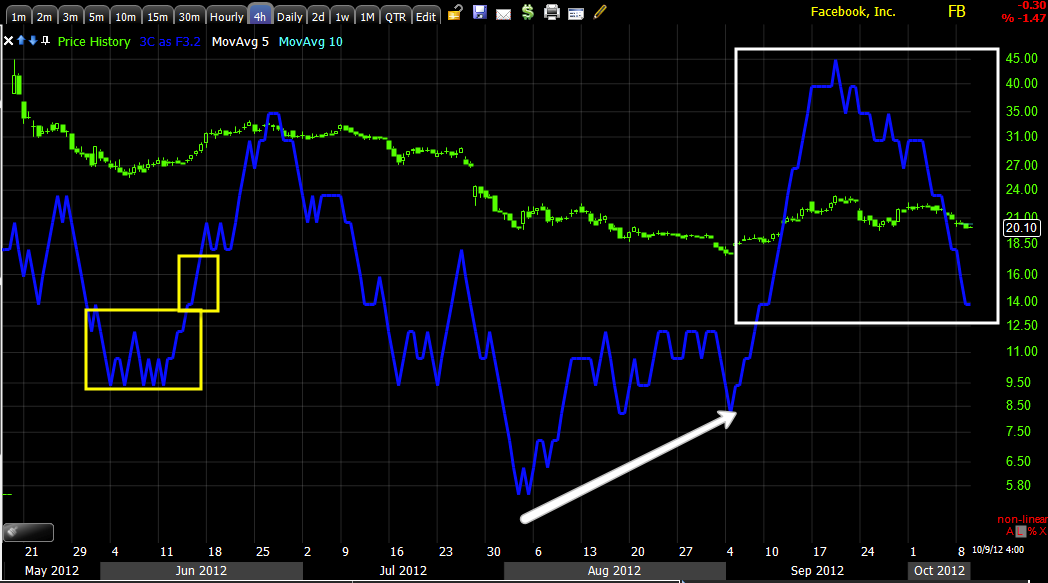
Several months ago we saw a small move in FB and although some played it and made some money, it was obvious back then that FB was going to start a larger base, how large was the question. Now after a recent pullback, FB looks like the downside momentum of the pullback is ending and it will continue finishing up the base.

 The FB base

 In yellow was the accumulation from the first FB long that was very successful, this current 4 hr leading positive divergence is even bigger.

 The FB 15 min chart looks good on the pullback toward the bottom of the base and is leading positive.

 A closer look shows the current pullback looks to be ending.

 The intraday charts are looking stronger, the 5 min is in leading positive position.

And the 3 min timeframe, which should bleed in to the longer timeframes, looks excellent right here. If I were considering buying or adding to FB, I would certainly consider this area.

AAPL Charts

 I never short initial breaks of H&S tops or almost any top, if we can't get in at something like the head where the risk is lower, I wait for the volatility shakeout that almost always comes after shorts enter on a break of an obvious top pattern like this. The move would need to be above the neckline and usually then some to shakeout the initial shorts that chased the move lower, that's where I'll be looking to unload the Calls and looking at short entries in non-leveraged equity short position.

 The 3 min chart continues to improve, not just today, but as a continuation from yesterday.

 The same is true of the 5 min chart at a new leading positive high above yesterday's.


And now even the longer term 15 min is positive.

Going to Add AAPL Oct $630 Calls Now

Yesterday's position wan't very large in the calls, this will be a bit smaller. This pullback intraday is what I was looking for with the charts improving.

Charts coming next.

This is basically a small leveraged long for a move up to shakeout AAPL shorts (now, rather than a 3rd shoulder) and I'll be looking to close it out ASAP at a profit and move to the short side with an equitiy short in AAPL.