Wednesday, October 31, 2012

Chicago PMI Misses

In one of the few US economic releases today, Chicago PMI missed this morning

Released On 10/31/2012 9:45:00 AM For Oct, 2012
PriorConsensusConsensus RangeActual
Business Barometer Index - Level49.7 51.0 49.5  to 52.0 49.9 

The PMI was released 30 minutes early, apparently a mistake by Market News, but this is what I tell you all the time, they have the numbers-just under an embargo, however it's a system perfectly set up for conflicts of interest.

While this was a slight beat to the prior, it was a big miss of consensus and in contraction. The employment sub-index fell to 50.3 from 52, only .3 above contraction-this also being the lowest print in 33 months.

PMI continues its march across the world in to the abyss.

OPENING INDICATIONS

Amazingly, even after 4 days, the intraday opening indications are RIGHT ON! I'll use the DIA/DOW as an example of what I think is probably early weakness intraday, maybe a gap fill and then the larger trend.

 DIA 1 min saw a positive divergence around noon Friday and moved up with 3C in near perfect price/trend confirmation, the opening this morning carried that on with perfect confirmation.


 A little further out the 5 min chart has an intraday negative divergence so I think we could see a gap fill or some softness earlier in the day based on this, however...

 Scale out the same 5 min chart and it shows the leading negative divergence from the highs of the 17th/18th and the leading positive divergence of last week, this is the bigger picture.

 IWM 1 min with a positive divergence Friday at noon, a small negative and a small positive and this morning's open in perfect confirmation.

 The QQQ, like AAPL with a late afternoon negative 1 min divergence as it follows AAPL and this morning total confirmation/in line, this will change when AAPL changes.

The SPY was the only that didn't have opening confirmation, but since it has fell in to perfect confirmation, it's amazing after 4 days that price ends up almost exactly where it should be based on the intraday signals from Friday.

AAPL Update

AAPL 1 min is where the divergence would first start and then migrate through the timeframes, like the leading positive around noon on Friday that lifted AAPL from its lows to a "V" shaped intraday move up, we are starting to see the same build on the 1 min chart.

 Friday's negative divergence toward the end of day and this morning a leading positive divergence starting.


As a reminder this is what Friday's 2 min leading positive looked like before AAPL gained about 21 points in 2 hours.

The Euro

In yesterday's post I mentioned how we see the strange effect of divergences in the currency ETFs like the Euro or USD and no matter what happens overnight, the divergences tend to be fulfilled, this is even more amazing, over a weekend and 2 days of the market being closed the Euro has fulfilled, or at least started to, the positive divergences from last Friday and last week! So far this never or very rarely fails, talk about a market that is controlled in these cycles! If this happened once in a while I'd be skeptical, but I can't remember the last time it failed.

By the way, a strong Euro means a weaker dollar usually, which means a stronger stock market.

 The near term 2 min leading positive divergence from Friday in the Euro/FXE, this morning it is hit right on the nose at confirmation!

 The 5 min Euro/FXE leading positive divergence from Friday, also hit exactly at confirmation in intraday trade.

 What  may be more telling and interesting is backing out and scaling the divergences to trend from intraday and you can see the 2 min still has a huge leading positive component that the Euro could or should catch up yo, this is positive 90% of the time for risk assets like stocks.


The same thing is seen on the 5 min Euro/FXE chart when scaled beyond intraday!

AAPL Chart Interesting

Here's a larger update on AAPL.

 From the decline to the bearish consolidation/continuation pattern with a potential head fake break below support of the price pattern, Friday afternoon we saw a strong intraday positive divergence at the bottom of that V as AAPL then proceeded to move higher. A head fake move completed would see AAPL follow the yellow arrow above the bearish price pattern that is very common in T.A.

 The longer term 5 min AAPL chart with the negative sending it lower, confirmation on the move down and a positive divergence in to the bearish pattern with a small negative sending AAPL lower from the top of the triangle and a leading positive in the break down area (potential head fake area).

 Here's this morning's open, triggering some volume as stops and shorts come in.

This 1 min negative divergence at the end of Friday was noted in this AAPL update Friday

We didn't have any idea what that negative late day divergence on a 1 min chart was about, but it seems clear now it was about the management shakeup that AAPL pulled as Hurricane Sandy had everyone's attention.

Right now we need to see the start of a 1 min positive divergence , which is just starting to show up, it needs to build quite a bit to be high probability, but I still think there's a good chance this turns out to be a head fake move.

AAPL 1 min right now

AAPL Pre-Market

After the big management shakeup at AAPL, it's normal to expect some volatility,  pre-market trade in AAPL is down -1.1% at $597-ish.

Compared to last week, you can see where the bid/ask are to the right at the hash marks by price.

While the normal market hours version of 3C is better, we can still get an idea from the extended hours version.

In early pre-market trade AAPL came down from highs of $603.93, 3C (1 min) followed it, but then 3C went to a relative positive divergence and the downside momentum started to subside until AAPL was heading lateral, at the lows of pre-market the 3C positive divergence was picking up steam until it moved to a stronger leading positive divergence and AAPL is starting to see a little upward movement.

The normal hours version of 3C is better for AAPL, but that's what pre-market looks like thus far.


Starting the week - Pre-Market

We're halfway through, but we are finally starting. I hope all of our friends in the North East are safe and comfortable in their homes, I've been through about 9 of these storms here in S. Florida and there are so many things that effect day to day life you never imagined, all of our best to all of you.

As the overnight session began last night and until I went to bed pretty late, there wasn't much to report, ES was pretty flat in a tight approx. 2 point range.


You know what my opinion was from my post yesterday afternoon.

As a matter of fact, we didn't get much movement in ES until the European open at 3 a.m. EDT.

Despite  the September European unemployment rate hitting a new record high overnight at 11.6%, Consumer Inflation staying high, French Producer Prices (margin squeeze) moving higher up, Spanish Housing permits seeing a 37% decline from July to August, the Greek 2013 economic outlook coming in worse than expected bringing Greece to  189.1% debt to GDP for 2013; it didn't matter that Japan cut their economic outlook as PMI (manufacturing) came in at 46.9-the lowest since 2009 and in contraction, it didn't matter that Taiwan cut 2012 GCP forecasts by nearly a third, and we could actually go on and on, IT DIDN'T MATTER.

JUST BEFOR THE EUROPEAN MARKETS WERE TO OPEN...

A Nice positive divergence in 3C on ES lifting ES over 10 points in the overnight session, we're a bit shy of that now, but still at a healthy move up.

Should this hold through the day, I think yesterday's post about cycles being set up and run as well as the FX divergences might be worth raeding again.


Tuesday, October 30, 2012

US Markets to Fully Re-open Tomorrow

And thank the lord, I don't think I could have taken another day of this.

There have been some interesting observations over the last 2 days, especially the defense of ES $1400 and EUR/USD $1.29.

 5 times the Euro has tested the waters below $1.29, each time it pops right back up (remember the Euro has a positive correlation to the market, the $USD has an inverse relation to the market).

The range area from last week, even with a head fake move below the range, now stands (as of the overnight ES close at 9:15 a.m.) near the top of the range. Again, $1400 is defended.

Despite a lot of bad news from a US disaster named Sandy, to AAPL's bad news to Greek bad news, the Canadian TSX is seeing a risk on mode, around noon time, the TSX's correlation transferred to the SPX futures would equal roughly $1425 and S&P cash $1430!

When ES opens for overnight trade at 6 p.m. tonight, it should be very interesting.

As you probably recall, we were looking for a range/consolidation before the market heads higher (which we positioned for last week), ultimately allowing us to sell in to strength.

My experience has been that Wall Street sets up these smaller cycles by accumulating or distributing and this is why I say reversals are a process, not an event as it takes time for them to re-position these large positions they put on or take off.

Last week we saw the range we were looking for, we even saw the head fake move that precedes the reversal more than 4 of 5 times we often look for as a timing cue.

Again, in my experience, once these cycles are put in place, they tend to be run, how Sandy will effect a planned cycle I can't say, I imagine some adjustments were made late last week, however one of the more interesting things we've been able to see where there's little to see is the defense of key levels and money flowing to the TSX.

Here's the 3C charts for ES and the NASDAQ futures over last week.

 ES 15 min 3C chart from mid last week in to this week with a positive divergence.

 ES 60 min from the week before and the mid-week reversal we saw coming, the loss of downward momentum and the range with a leading positive divergence.

NQ/NASDAQ Futures with the same time frame and leading positive divergence.

"If" the TSX is telegraphing the US Equity markets in some way (and we'll know more when ES opens tonight and through the night), the US markets may make up for lost time with a big gap up, one that would catch a lot of late last week's shorts way off-guard and feeling more than a little squeezed.

As a reminder, the $USD which is seeing some weakness this week in FX trade, was telegraphing that weakness to come this week with negative divergences late last week.

 After the $USD (UUP for intraday) gapped up last week it stayed in a range with a 10 min leading negative divergence building, note the positive divergence just before it gapped up.

 The intraday charts too, which are good for timing, were showing the same, above is the 2 min in a leading negative 3C divergence in that range, and below a 1 min chart also leading negative.

1 min $USD (UUP).

On the flip side of that, the Euro was telegraphing positive divergences last week (positive for the market near term) and we've seen how these ETF divergences will wait to play out until the actual equity market is open!

 Euro (FXE) 30 min leading negative at mid week the week before last as we saw and the range we expected last week with a leading positive 30 min divergence in the Euro. Even though the Euro has held its own this week thus far in defending $1.29, the divergence seen here has not been fulfilled with a solid move higher.

 Euro 10 min with a strong leading positive divergence last Friday, after we got the potential/probable head fake move below the range.

 The 5 min chart showing the same reversal to the downside on a negative divergence, a range or loss of downside momentum to a consolidation with a leading positive 3C divergence.


And interestingly, for timing a 2 min very strong leading positive divergence last Friday.

The averages had already put their positive divergences in place by last week...

 DIA 15 min leading positive divergence

 QQQ leading 30 min. positive divergence

SPY 15 min leading positive divergence.

And most of all we were looking for this to happen in a range, it didn't have to be perfect and as I said before it started, you probably wouldn't recognize it until it's through.


Finally I can't finish this post without mentioning the leading indicators we use, while some (and probably VERY few) may have changed a bit since last week, the trends were very strong and in positive divergences with the SPX; these have served us well in the past as leading indicators.

We may very well have a very interesting market tomorrow, we'll take it one bridge at a time though and see what ES looks like in a bit.


NASDAQ and S&P E Mini Futures Close 1 Point Off Overnight Highs

With the Equity Index Futures closed at 9:15 a.m. for the overnight session, we saw a pretty decent close.

 ES closed 1 point off the overnight session highs at $1411.25.

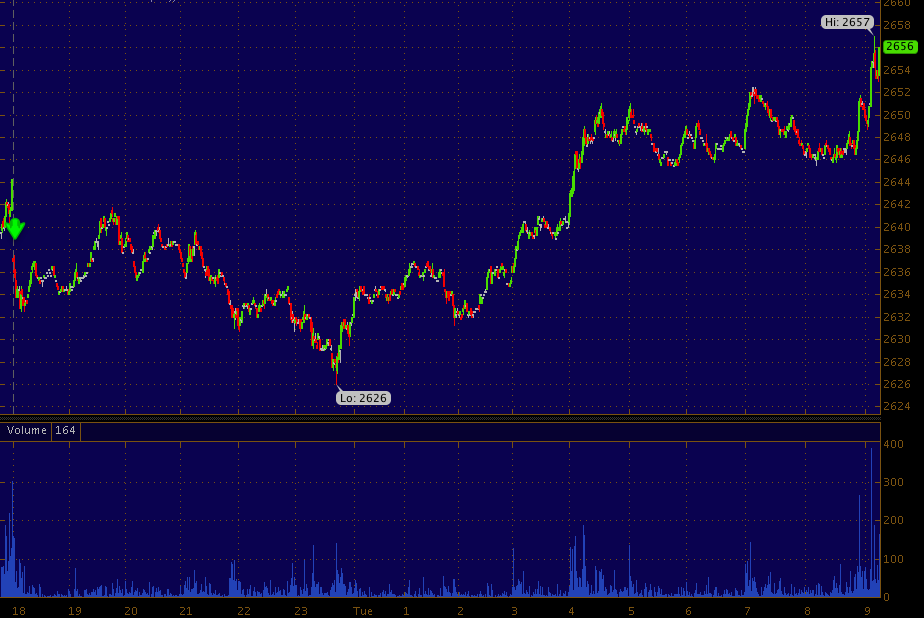
 NQ closed 1 point off the high as well at $2656


The EUR/USD since opening this week at new highs which is supportive of the market.

$1.29 defended onc again sending EUR/USD to new highs for this week.

Second Day

Again the US markets are closed today, I did read they are planning to open the NYSE tomorrow.

Overnight China conducted the largest reverse repo on record of 395 bn yuan. Not to be outdone by this massive injection, Japan came out in the middle of the night with an announcement of an additional 11 trillion yen of assets to be monetized or their 9th QE program. However because consensus expected more from the BOJ, there was no stimulative effect at all as the USD/JPY plunged immediately, the falling dollar helped ES rise from the overnight lows and back above 1400.

Otherwise Spanish and Italian yields are down, no matter what the news in Europe, those are the barometers.

The bottom line thus far is someone is protecting ES 1400 and EUR/USD 1.29 until the markets open, but considering we have had 5 days of this and only 2 days of the markets being closed, it seems likely that our idea of a rangebound market and upside reversal is holding water.

 ES opens last night at 6 pm for the overnight session, once again 1400 is defended for ES and the S&P.

 Defense of 1400 this week so far.

The open of FX trade this week and the defense of Euro/USD $1.29, which is essentially defending the market.

I don't know that the PPT did or did not step in as the BOJ action sent the $USD lower, but I have a feeling they are on call just in case they need to spend a few million and send ES back above 1400.

ES will close again at 9:15 a.m. EDT.

More as it develops