Wednesday, November 28, 2012

UNG

Thursday as usual we do have the EIA Nat Gas report, at least with that one they give you consensus. Nat Gas has been getting knocked around by talking head on TV lately, "A warm winter" blah, blah, blah. They don't get it, UNG's huge change in character which is when we first started following UNG and then the huge change in trend (some of you are up 20% to 45% and it hasn't even broken out of the base to stage 2 mark up) has nothing to do with winter forecasts and everything to do with US energy independence and the new law signed this year on power-plant emissions which makes building a new power plant in the US a two proposition scenario, nuclear or natural gas; clean coal can't pass those emission laws.

Don't forget all of the strange stuff like the congressman pumping Nat Gas during Bernie's semi-annual Congressional testimony, as if Bernie was an energy expert! However the congressman knew that every investor out there would be watching, it was like a super bowl ad for nat gas.

 Why do we like UNG other than the huge change in character?
 For starters the 2 hour chart's leading positive divergence through the entire base.

 UNG is a longer term position, not a trading one and it should provide a great gain for those who can stick with it, it needs to break out of resistance with a big volume spike, this is what traders believe is a sign of smart money buying, but as we know, smart money was in long ago. That move up and spike in volume are a billboard that tell traders, "Look at me!" and that's when UNG moves to stage 2 mark up or where we see trends.

 It's not uncommon for an equity to back off a major resistance area and gather a head of steam before going for the breakout so this trade is pretty normal.

 On the 30 min chart locally there was no negative divergence in UNG, it doesn't look like anyone is letting go of shares, instead it seems they talked it down.

 On a 15 min chart in yellow, no neg. divergence.

 15 min chart zoomed in shows some recent accumulation in the area.

 Even a 5 min chart shows almost no distribution which they usually need a little to get  pullback moving, there's a nice leading positive today.

The 1 min chart shows a bit of distribution, but this is tiny, we have a decent intraday move here, I think it's probably a good area to continue to build on.

If you like UNG and want to add a bit or initiate, now's the time

Remember we have EIA Nat Gas report tomorrow a.m. so that could cause volatility.

Charts coming.

AMZN-

Ooops, I had to close an AMZN long first,

At the fill it would be a 5.4% gain.

Switched around and opened anEquity short in AMZN.

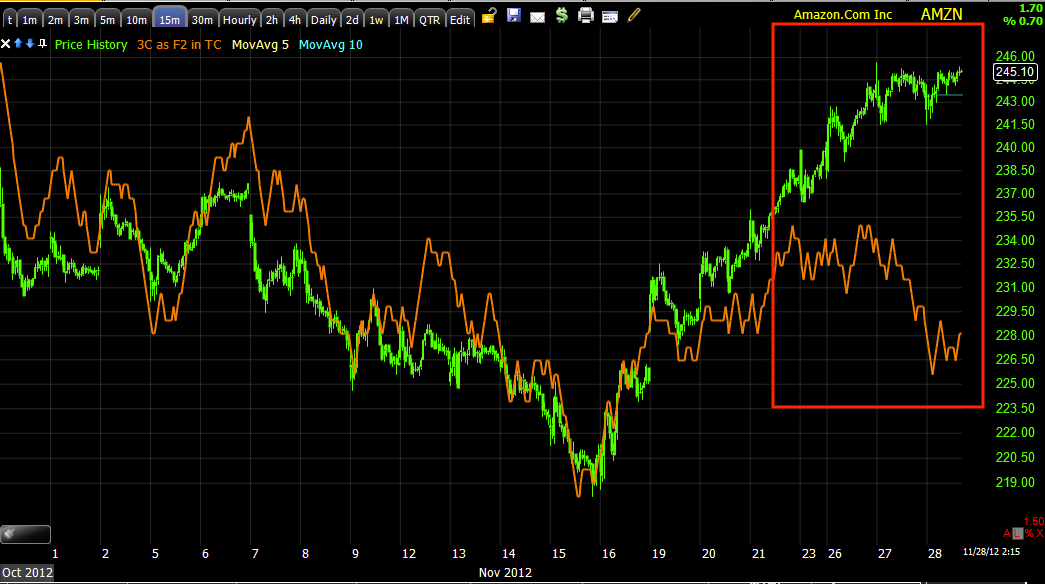
 With a 30 min negative divergence AMZN has a bit of a worse negative tone than the overall market so that is one reason I'd chose AMZN as a short to play some downdraft in the market, who knows if we get some snowball momentum.

"IF" AMZN shows strong accumulation in to a pullback (because this run looks a lot like short covering as there are no pullbacks), then I'd consider AMZN long again, but it has to show something above and beyond what the average is.

 The 15 min chart, I'm not putting all of the negative charts, just enough to give you an idea.

On a 1 min chart the trend is clear as AMZN is more or less in a flat range, which is exactly where we look for institutional activity. The only thing missing is a head fake breakout above resistance, but that's really only 2 days of resistance, it may not be that obvious to make it worthwhile.

AMZN-Short

If you have time to watch it and cover it on notice that may be over a half day or so, AMZN looks like a decent short for a decent size PULLBACK right here. I think I might open an equity short there and I'll post some charts.

It's in a good position right here.

AAPL is going negative

It's a bellwether, the market shouldn't be far behind. Just about all intraday charts in AAPL are negative.

RIMM Update

RIMM is one of the few long positions that I like, that I think can stand on its own feet without needing to draft the market. There are only a handful of these stocks and as I suspected way back when and as has developed since the announcement of QE3 (and I'm pretty sure I know why we are seeing this-but that's a longer story) it has been the high fliers getting knocked around and the beaten up stocks seeing money sniffing around. Here's a hint, if you were a fund manager would you rather the F_E_D told you straight out, "We will maintain ZIRP rates until June of 2015" or would you prefer, "We want to tie our quantitative easing and open market purchases to the incoming economic data and adjust as needed"?

I think most would go for the first because it is certainty, lacking certainty as the F_E_D discusses this new yard-stick for policy, I think many managers feel more comfortable in stocks that are around a 10 P/E on average rather than a 15 or 20 in case the F_E_D all of the sudden changes policy on a Non-Farm Payrolls report.

OK, why do we like RIMM?
 The change in 3C's character on a daily chart is pretty self-explanatory as to why we like RIMM, major shift in sentiment toward RIMM and they are putting their money where their mouths (well they probably aren't talking too much about it yet).

 The 60 min chart in RIMM is fine, it's in confirmation of the trend so no trouble there.

 A 30 min chart is about as far out as we can go to see a hint of a negative divergence in RIMM, this is along the lines of the overall market so again it's not a problem, more like an opportunity.

 A 15 min chart makes the divergence clear, but it's small, it's just enough to send RIMM in to a pullback, it's not serious distribution like we were seeing in AAPL where funds REALLY wanted out.

 We want to buy RIMM in to a pullback, let it come to us, but we want to see accumulation of the pullback to know when its time, we aren't there yet.


 The Clear method shows RIMM with two reversal candles, both on rising volume, that was your cue that a near term reversal was coming, the clear method so far on the daily also shows there's nothing standing in the way of ore downside in a pullback. If you didn't get in when we were watching the base (you'd be at a 50-75% profit right now) then the next best thing is on a pullback at lower prices/less risk.

As for stops, I'm inclined to give 3C a strong voice in any potential stop, but just using the Trend Channel, the tighter is at $9.60 and the wider is at $9. Again though, I'd look at 3C before deciding whether to stop out and I'd use the wider channel, in fact I'd prefer $8.85 on a pullback.

Patience, this will come to you.

Market Update

Still nothing unusual or worrisome to report. As I always remind you, reversals (scaling depends on the timeframe and size of a move) are a process, not an event so we rarely see "V" shaped reversals and more often sort of "U" shaped which may put us right around the 2 pm or so mark that I mentioned earlier as being a good place to see a downside move.

The TICK has mellowed. As for the averages and intraday signals, much like we saw just before the pop on the 16th, the longer term charts like 5 and 10 mins are giving bigger negative divergences on an intraday basis than some of the shorter 1 or 2 min charts which is rare, but would suggest any distribution in to today's bounce off the lows is being sold in pretty decent size.

I'm going to update some individual stocks that we like or we are in, unless something more pressing develops.

Euro Giving Signals

In the last post I showed you the start of a negative divergence (intraday) as well as the longer term in the Euro which is what's moving the market right now as it makes a counter-trend correction.

That negative divergence is getting worse so we are likely getting closer to a reversal point intraday. For closing trade I'd like to see the market head lower from 2 or 2:30 through the close, that's sustainable.

I'll take a look at some other assets, but this I think will be an important signal for intraday trade and I wanted to bring it to you in case you need the information for tactical moves.

*While I've been putting this post together it has grown worse, it's now seeing 3C near lows on the chart

Still all about FX

The near term trade is still moving very much like a typical legacy arbitrage correlation, I'll show you what I mean, not that it has any bearing on the pullback, it's just like I said this morning , "It was too early in the day for the market to hold that kind of move" so now it has to kill some time, play some games. This is exactly the kind of stuff you want to understand so you don't let emotions drive decisions.

Here we are...
 Here's the SPY 5 min in green with the Euro in red, they move exactly alike as the Euro is a sign of risk on and the $USD moves opposite as a risk off currency (when it rallies).

 This is 1 min EUR/USD 3C overnight trade with the negative divergence after the European open at the green arrow, then a slight positive divergence at the 10 am lows and right now as the Euro stretches its legs, 3C is not following it higher so this may be the start of a negative divergence and some volatility to the down side. Nothing on the charts of the averages would prevent that.

The bigger picture of the EUR/USD is this 15 min 3C chart with a large negative divergence, we already saw the head fake move yesterday, this is an ugly divergence and just like the post last night about different timeframes and the "waves" analogy, this move to the far right is like a wave rolling up the beach within an outgoing tide, a newly outgoing tide, but nonetheless.

VXX Charts and Stop

You already saw the VXX/UVXY charts in yesterday's post and that will be more comprehensive.

You also saw the VIX post from yesterday as well with a BB buy signal.

 This is VXX this morning on a 1 min intraday chart, there's some improvement recently, it's at the area I mentioned it yesterday so I'm not too worried about hitting the exact bottom. As with most positions for a pullback trade this is speculative or about half size as it is counter trend to the bigger picture charts that have been building a strong positive divergence since late October, the 16th was the start of that move, but like any good Wall Street trend reversal, there are going to be shakeouts to throw anyone who thinks they are a step ahead of WS out of the game.

 The longer term 15 min chart is what is really impressive about VXX and UVXY, this suggest a move quite a bit higher than anything we saw this morning, it's not only a leading positive in an important timeframe, it's got some size to it as well.

 If you are looking for a stop, the 60 min Trend Channel can work at $29.70, I prefer to allow more room on initial positions and when VXX moves up a bit, I'd prefer to switch to a wider daily channel, however in the timeframe I'd imagine we'd be looking at trading this, the 60 min chart has held just fine.

On a 30 min chart we have the first of the X-over moves on this screen with ll 3 indicators long, the reason I really mention it though is because the 10 and 22 bar (30 min) averages should be the key averages to watch for the time being.