Tuesday, September 3, 2013

Trade Idea: TECL (long) XLK

The Tech sector is looking very interesting, I added TECL Friday, a 3x leveraged long Tech ETF and I have an open XLK October $31 Calls, I'm going to add a little to both of those positions.

I don't think you need both at all and if I had to choose I'd probably pick TECL, but I think the call is nice for initial momentum which I could have cashed in on today (XLK calls are still in the green).

Here's TECL charts... I like them here and will likely add as soon as I post this.

 2 min Friday and improving quickly today.

3 min in a leading positive since Friday, no damage today at all, looks great.

TECL 5 min has seen the migration of that 3 min leading to a 5 min chart leading positive, this happened very fast.

The 10 min is even leading

As is the 15 min after first putting in relative positives as is the normal progression of a divergence, look at the start of it as well, 8/ 16. That 15 min leading positive is the kind of divergence that is very hard to ignore.

 An hourly chart even gives us a strong positive trend. Now look at the opposite of TECL, TECS which I closed (long) Friday, it should give the exact opposite signal to confirm.

TECS (3x short Technology) is leading negative on the 60 min chart, good confirmation, I like this and the broad Tech group is fine for me for this kind of move, no individual stock risk

Market Update

After this I'm going to start looking for some positions that I had a gut feeling we might get a second chance (SCBO=Second Chance Buying Opportunity) as I said in last night's "The Week Ahead" post,

"Hopefully if you didn't have a chance to make some moves Friday we'll get a little breather tomorrow and find some positions we can add, but Friday was busy for a reason, I'll leave it to you to judge whether you think the President of the United States makes a decision that big in just a few hours (after the market closed)."

If there is ANY discounting of risk today (I kind of doubt it, although I can't say for sure, I think this is more about traders who were gone Friday and yesterday -pros- creating an opportunity to get long at lower prices ), but if there is any discounting of risk today, my gut feeling over the weekend was "There's so much coverage of Syria this weekend, it could cause a little spook short term or knee jerk, but traders will come back to the realization that there's likely about 10-days before anything is probable to happen and that's not even sure". So again, I had a gut feeling we'd have a knee jerk pullback as I mentioned above in last night's post, but as usual with knee jerk reactions, sense starts to creep in and the market says, "Hey, we have at least a week and a half to run amuck!".

I got off point, which was if there's any additional discounting of risk it's that the US has an aircraft carrier moving in to the region, while it seems pretty clear the President doesn't or didn't want to do anything with live pilots or boots on the ground, that aircraft carrier creates some uncertainty as to why it's there for a Tomahawk strike. In my view, it's a show of force to Russian naval ships in the area, it's a contingency if things were to get out of hand and it's a contingency "IF" Congress says "OK, but we want more, not less".

As far as the market, I'm glad to see HYG still moving in to a positive position, it looks clear it was knocked down today to accumulate at lower prices and the aircraft carrier could have been the "cover" they needed to do that.

Here's what the market is looking like, I'm not feeling any great urgency as far as missing an upside move, but the IWM is leading as it should and looking better and better, also as mentioned earlier this morning, the TICK data has done what was expected and this trend in TICK data is very important for timing.

 XLF clearly shows why I was so busy Friday with a major change of character very quickly on a normally quiet day, you can also see the improvement and turn toward the positive for today since the a.m. gap pullback.

XLK, the Tech Sector 5 min is showing no damage, also the recent unusual strength (we had positives, these just flew in quickly late last week/Friday).


 ES intraday (S&P E-Mini Futures) are going positive.

IWM was the first to go positive and it keeps doing so, apparently retail short selling that creates supply is being soaked up by smart money, this is great for anyone who wants a long position who didn't have a chance Friday and I'll be looking at those next as we are getting closer to the point in which timing is starting to look more ideal.

 The unusual strength Friday in IWM and the 2 min migration today improving as well.

Remember last week the 1 and 2 min charts were moving at a predictable pace and out of no where 5 min plus charts started going negative very quickly.

IWM 5 min with relative and leading positives.

IWM 15 min, this is what's important, the 16th of August is the date we see everywhere, it's an ugly "W" base, but the more times it sucks up supply at the base, the stronger it becomes.

QQQ intraday with Friday's unusual positive at the large white arrow, distribution from retail on the gap open today and positive divergences coming in .

 The same features, plus migration of today's positive to the next timeframe intraday -2 min

 QQQ 5 min overall looking fine, I'd like to see migration there too, but it's not needed as it's already in leading position.

The SPY seems to be the laggard today, we saw that last week too with the IWM leading and SPX and Dow lagging, it's odd to see such broken correlation because it's definitely not healthy sector rotation.

SPY 5 min positive Friday, the 2 min has not seen migration yet, but I just looked again as it takes some time to capture and load these charts and now this timeframe is in line so that's improvement and the 1 min is improving.

3 min is in line, it really didn't see that much damage from the early gap opening fade.

The TICK as I mentioned earlier "Would probably move in and out of the channel several times", but now it's time to start watching for a new channel/trend to develop here.


Trade- Idea: HYG

This is not a trade I personally am interested in, but HYG is a catalyst and it's a leader so it needs to move up for the market to have a healthy bounce, there's not a lot of beta in HYG, I think it's most appropriate for larger portfolios and that's exactly who uses it the most, smart money, in most of our cases I'd use options (calls) with some leverage to make up for the lower beta, but it looks like a high probability position and it has been doing what I fist saw in the initial update today. If you do look at options, I'd make sure there's enough liquidity in the strike and expiration you chose.

 This 60 min chart isn't beautiful, but for where the market is now, it's a clean enough trend that has been part of the analysis suggesting a bounce with a positive in HYG on 60 min, again, not a great one, but about as good as you can expect for any asset considering where the market is.

This also of course, means that probabilities for HYG are "Higher"

The 1 min chart that gave me a sigh of relief earlier has continued to build positive and has migrated to longer timeframes, price also has a nice "U" shape with 3C stronger where it should be intraday.

The 2 min is positive as well as the 3 min.

At this point I'd prefer to try to get HYG on a head fake shakeout below intraday lows and maybe I'd set an alert looking for price to do that, it would make the position more appealing, but if I was interested in HYG either way, I'd have no problem entering a spec. long here with the understanding there's a good probability that the intraday lows see a head fake / stop run before HYG moves north.

The 5 min chart is in line which is better than negative, if it goes positive as well, HYG looks even better as a long.

This also has market implications as this is the asset of choice for smart money because of it's size/liquidity, as we sat often, "Credit leads, stocks follow".


Silver / SLV Update

If you've been around for a while, then you know my least favorite asset to try to analyze would be Silver (SLV). that's partly because of the 3+ year intense JPM manipulation of Silver prices by their own Blythe Masters as JPM inherited the large silver short when they took over Bear Stearns, in fact JPM just won a Silver manipulation lawsuit, I'm not 1005 sure, but I think I read the opinion was something like "They probably did do it, but the case wasn't made" or words to that effect. There was the internet/viral campaign of Max Keiser , "Everyone buy 1 silver dollar and break the JPM short" from that whole ordeal to the actual distorted price ratio of historical silver / gold which had silver exceptionally discounted vs. gold prices according to historical ratios.

This has just been a nightmare of an asset to analyze and as a result, silver positions have historically been few and far between here. The recent SLV September $24 Puts worked out, that position was phased out of in two parts last week, the first making +30% and the second +54%, I don't mind trades in Silver IF there's a strong, objective evidence backing it up. When I chose options over straight equity longs like SLV or leveraged ETF longs, I'm basically saying, "I like the trade, but to make it worthwhile, it needs leverage" and that typically stems from the trade not being a very long term trade.

You see, as many option positions as I have put up over the last 6 months or so, you have to understand I REALLY don't like leverage and only use it when I think there's a great high probability trade/signal, but there isn't enough profit potential to make it worthwhile and with a market that is topping we get a lot of ranges and chop and it's difficult to enter positions for swing or trend trades in that environment so I have to resort to the best tool for the trade and that often means a short trade needs leverage to make it worthwhile. If I thought SLV was a swing trade of 2 weeks or so, I might go with a 2x leveraged ETF. If I thought it was a trend trade of over a month, I'd probably just go with SLV with no leverage.

So, that's some information you can glean from the type of position I chose, I really prefer not to use leverage, but when you are trying to take what the market is offering, you have to use the right tool for the trade.

Moving on to SLV and Silver futures, I did close the Puts last week in 2 parts, you'll see why and there are chart updates from Thursday's closure so you can check those out as well. Basically right now, Silver has multiple trends as is often the case with an asset, but there's not great confirmation of any single trend for longer trades, there will be, but not yet in my view.

This is going to be a little difficult to follow because there are multiple trends in place. The longer the chart, the more important the trend or larger the trend, but with multiple trends in place, the longer the chart, the further off the fulfillment of that trend and it may see numerous short to intermediate trends interrupt the longest or Primary trend.

Perhaps I should have started from longest to shortest, but for immediate usefulness, I thought working from short to long was better.

 SLV 1 min Intraday it does look like Silver/SLV will either continue to consolidate sideways longer, however the most recent 3C reading to the far right shows it starting to lead negative.

A 1 min chart's signal alone has about a 50/50 chance of a correction being either a sideways consolidation or a price correction (pullback), both are corrections, one is through time and the other through price to work off an overbought condition which is really to say "To let the weak hands fold".

SI (Silver Futures) 1 min show the same trend emerging intraday so that seems to be leaning toward a pullback.

The 2 min chart doesn't help much, if it were clearly negative, then a pullback in price would be high probability, much higher than a 1 min chart's 50/50. There is some 2 min weakness developing from the intraday in line, but in perspective non-confirmation. At this point, I'd give a slight edge to a price pullback, if the 2 min chart starts to give a stronger signal, then I'd increase the probabilities, the problem is that it needs to really show a stronger signal and maybe move to the 3 min chart because the 3 min below is strong.

SLV 3 min This shows an initial relative positive divergence Thursday so half the put was closed and Friday a stronger positive divergence so the rest of the Put was closed at a larger gain. Because of the overall charts Friday, I chose not to open a long in SLV, probabilities of a downside move slowing or ending does not mean probabilities are high for a reversal, often we get a flat period of trade.

SI 5 min the 5 min futures are similar to the 3 min in that they are in line or confirming, this is why the 1 and 2 min (especially) charts would have to deteriorate more today for me to feel the highest probability intraday is not just a sideways consolidation, but a pullback. Conversely as the day goes on, the 1 and 2 min chart can start to improve and increase the chance of SLV making higher gains, at that point it might be worth a position, but it would have to be strong considering the risk.


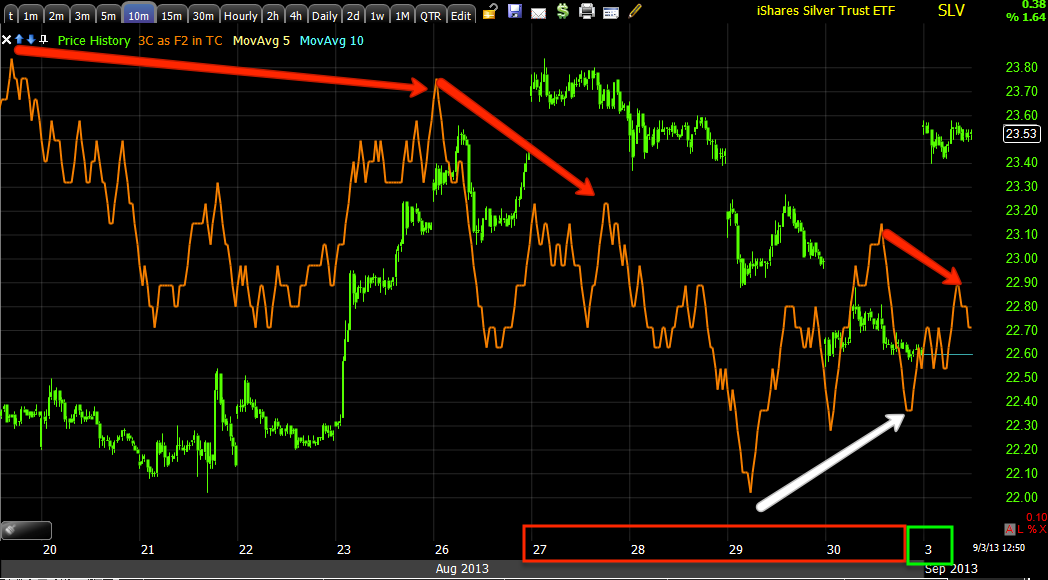
SLV 10 min is about an intermediate timeframe and beyond what happened since Sunday night, the larger trend here is down, but there is a counter trend positive divergence (white) that moved SLV up. Since then there's a small negative, so I'm guessing that probably within the week, SLV will fall back in line with the larger downtrend here.


SI 30 min suggests the same thing as it also showed a counter-trend bounce and that bounce not as strong right now as it should be at the red arrow, it looks like a counter trend move within the downtrend above that is probably best classified as a semi-intermediate (shorter than intermediate, but longer than short term).


SLV 60 min suggests SLV's down trend (semi-intermediiate) is real and SLV will see that continue, in the VERY short term (intraday or the next day or so, it's the 1-3 min charts that will be most important for very short term trade).

If I had an SLV short here, I'd probably hold out, if the 1-3 min charts went negative clearly, I'd probably establish a short silver 2x leveraged ETF as I think there's a longer trend or long enough to not need options leverage.

SI 60 min futures in the same timeframe tend to confirm that view.

Now here's where a longer, perhaps intermediate trend, maybe even building to a primary trend starts to reveal itself.

SLV 4 hour this chart shows a strong accumulation zone, If I had to guess, I'd guess SLV maybe comes down with a market bounce and forms a large "W" base with the first bottom of the "W" already in place at the white box to the left.

SI 4 hour the futures chart in the same timeframes went from in line on the downtrend to a positive and that positive with a smaller negative that suggests that pullback, but it would be a constructive pullback to create a stronger base and stronger/longer uptrend, it doesn't mean it can't be trader on the short side though.


SI 1-day This is where the intermediate and if we do get a larger "W" base, probably a primary bull market emerge in silver.

To the left 3C is perfectly in line with the downtrend, the leading positive divergence is a MAJOR change of character, so I'm guessing Silver has a lot more upside over a longer time period.

THIS IS ONE OF THE BEST EXAMPLES OF MULTIPLE TIMEFRAME ANALYSIS THAT LETS YOU GET A ROUGH IDEA OF WHAT TRENDS YOU WANT TO TRADE AND WHAT KIND OF TRADES ARE BEST SUITED TO THEM. FOR A PULLBACK TO A BASE, I'D USE A 2-3X LEVERAGED SHORT, FOR THE PRIMARY UPTREND I'D USE NO LEVERAGE AND ONLY USE LEVERAGED TRADES ON SHORTER TERM CORRECTIONS WITHIN THE PRIMARY TREND.


Market Update

I'm putting this post out just so you have an idea what to look for if you want to time any positions that I may be throwing out your way, I can't watch every single idea for the best timing, I try, but I'd rather give you some tools and explain what I look for and hopefully you can use it not only today, but all of the concepts can be scaled out to whatever timeframe you want to trade in, day trade, swing trade, position trade/trend, etc. I'll be working on more specific analysis and trying to get to some emails after this.

I'm just looking more at timing now, I think if retail wants to sell the rip (short it), Wall St. will give them enough rope to hang themselves, last night I kind of suspected early action would look like this and mentioned that we might see it and those who didn't make moves Friday may very well get a chance today, but I didn't have anything concrete to base that on other than gut instinct re: retail and a bit of knee-jerk reaction considering the heavy news coverage over the weekend, but the end result is still, Congress has to vote and it doesn't appear there's much of a rush.

So the leader of any risk on move "should" always be the Russell 2000, so we'll start with the IWM.

 This is a 15 min IWM chart, it shows most of what we need to see for a bounce with initial indications which started coming in 8/16, the white blocks are areas 3C shows accumulation.

If we go to a longer chart, the trend becomes more clear, we lose detail, but it's always worth looking at to put things in perspective and smooth out noise.
 
 This 60 min chart of the IWM in a leading negative divergence is the primary underlying trend or VERY bearish, as I keep saying, "The big picture isn't off in the near distance, I believe 98% we are in it now".

This doesn't seem to be sending the message I was trying to communicate above, but this is part of "Multiple-Timeframe Analysis" so I'm giving you context. Lets look at the same chart zoomed in.

The 60 min zoomed in is not in a huge or VERY obvious leading positive divergence here, but it is leading positive, this is within the context of the primary trend of course, but it does show us the change of short term underlying movement to a more short term bullish stance which is what the expectations of a bounce have been based on.

 Now to the other end of the IWM spectrum at 1 min or intraday, this is one of the few averages that is starting to see the 1 min chart go positive, I suspect retail has done their shorting and are running low on more bearish demand at this point. I suspect smart money is picking up supply out there from retail and that is why the IWM 1 min chart went from a negative divergence on the open to bring prices down as smart money stepped back and let retail guide the market and now smart money is coming in and picking up all that extra supply created by retail short selling in to the "Rip".

Obviously we need to see divergences migrate to longer timeframes and I always look for a reversal process, which is just a function of the size of smart money positions and the time it takes to put those together without driving price against them by soaking up too much supply at once. The point being, it appears the initial a.m. trade is now starting to reverse and move back on course for a bounce that will likely squeeze retail and help bounce momentum. As I said, a couple of days of upside momentum and retail will flip, they are fickle, but in addition Technical Analysis DOGMA teaches, "If you enter a trade and it stops you out, enter the trade in the opposite direction". Basically, "If you were wrong, enter the opposite direction" which usually refers more specifically to false breakouts and more specific situations, but a strong squeeze would have the same effect.

The 2 min IWM is NOT showing migration of the 1 min divergence YET, but it is "in line", which is better than leading negative.

As a "Conceptual Feature", I wanted to point out in yellow the stop run or a type of head fake move in yellow, it's under intraday support where stops would be placed, as I often say, we see these on all timeframes and they typically precede a change in trend which is in context with the trend we are looking at (proportionality), the verification of that being a head fake move is the strong positive 3C divergence as it happened, meaning the stops that were hit, were accumulated and this is how we verify head fake moves from real break downs, this type of head fake move makes for an excellent (long in this case) entry as you get a better price with less risk as well as high probabilities as head fakes are run typically just before a reversal.

However the point here still being that this 2 min chart will need to go positive and then the 3 min before we see anything exciting in terms of an upside reversal.


 The other concept is that of reversals being a process, not an event so they are more "U" or "W" shaped vs. "V" shaped and this is not without reason, it's the size and time it takes to fill the size of the orders that will cause the reversal, it's not arbitrary with meaning attached only by habit such as "Support at the 50-day moving average", there's nothing in price whatsoever that places importance on a moving average, that's all human habit that creates that, that's very different than the reversal process.

The SPY is finding some support at the 5 min/50-bar moving average, I use this because it's popular with traders for intraday moves, so that's also interesting.

The NYSE (1 min) TICK is going to be important, thus far today it has trended with price, but a break above the channel can precede a price move (you really have to watch though as it can happen pretty quick. I'd expect we may see that a couple of times before the process is over. Actually as I type right now, TICK is breaking above the channel, that's as price flattens out near the bottom of the "U" I suspect, we are still subject to intraday head fakes and a break to hit stops or drag in shorts on the bottom of the "U" (support) as these occur in ALL timeframes.

 The VXX is also key to watch for a reversal, it went negative Friday afternoon, this is why I opened a UVXY long and VXX Sept $17 Puts.

However the intraday chart here will have to go negative too and it looks like it still has some upside momentum before that happens as well as migrates.

The 5 min chart is more important and shows the higher probabilities which are, the VXX will go intraday negative and continue lower with the market heading higher.

***And HYG is looking better intraday/3C so I'm not concerned about it as the data keeps coming in like I was on the open before any data was available.

Market Update

I'm still collecting my initial impressions. Retail apparently is not buying this move, it's no longer "Buy the dip", but rather, "Sell the rip", but they are fickle, as I said last week it will probably take a couple of days of 1% PLUS gains to swing them to the bullish side, but from my retail sentiment sources (aka: Sam the Great) it seems the "September Seasonality" is what retail doubts. In fact just as a measure of retail, our options tracking portfolio is in the top 10 just from the changes made Friday, that gives you some idea of what retail was thinking as they were on the absolute wrong side of the move today.

Speaking of sentiment as it relates to retail traders,  from a little book every trader should have for at least some general reference, The Stock Trader's Almanac, they have this to say about September (generally-this is just a snippet)...

"Since 1950, September is the worst performing month of the year for DJIA, S&P 500, NASDAQ (since 1971) and Russell 1000....Although September 2001 does influence the average declines, the fact remains DJIA and S&P 500 have declined in 9 of the last 15 post-election year Septembers. "

Several well known financial sites have also put up charts showing September as a disaster vs. other months of the year.

I respect history, I like what Mark Twain said, "History doesn't repeat, but it does rhyme" (paraphrased).

The way I look at the "Situation" with Syria and the market is that we have been looking for this decent bounce, although the underlying tone of this particular bounce cycle is very weak for obvious reasons (it's likely to be the last or as I have been saying, "We are not close to the big picture, we are in it now"), in any case, the 10-days or so it will likely take Congress to get a vote together is a perfect time for a bounce, the uncertainty leading up to the vote and perhaps just after is the perfect time for a sell-off and net/net September may still be one of the ugliest months of the year EVEN WITH A SUBSTANTIAL BOUNCE. 

The gap from this morning WILL be filled, but it doesn't need to be filled until the bounce is over so it can just as easily be filled in 10-days or so on the way down. 

One bridge at a time though and we are in the very early stage of a new week coming out of a.m. trade, my main concern this morning is not what retail thinks, THEY'LL DO AS WALL ST. TELLS THEM (with Wall St. using the psychological power of market movement), MY CONCERN IS MORE WITH SMART MONEY.

HYG is down this morning and while I FULLY expect the underlying trade and other indications to look HORRIBLE in to a bounce at this stage, I don't like it this morning.

The saving grace this morning may be this intraday HYG chart which did sghow a late day negative divegrence Friday so I suppose weakness early Tuesday is not to be unexpected.

 I did not like the opening of HYG as a measure of "Locals'"sentiment (pros), but 3C did show a negative around 2:45 Friday and amazingly as I have shown you probably 50 times in the last 6 months, the ending 3C charts at the close, always pick up on the next trading day EVEN OVER A 3  (or effectively 4- day because most of Wall St. took Friday off for a 4-day weekend) DAY WEEKEND.

The saving "grace" here is the rounding of price and the start of an intraday positive 3C chart, it kind of looks like HYG was intentionally knocked down to purchase it at a cheaper price and why not if Wall St. had a head's up on Obama's sudden turn to Congress?

The 2 min SPY was leading positive so the gap up is not a surprise, this is "part" of what I was seeing Friday that had me so busy moving positions around.

The opening indications here are not that of early confirmation, they are that of "sell the rip", which retail is undoubtedly doing this morning, give them another day or so of positive market momentum and they'll be screaming longs.

This is the 1 min SPY, this shows there was no confirmation of the gap up, smart money isn't going to buy it, they were already in and moving in at break neck speed Friday, so retail is obviously shorting the gap up, that makes for a short squeeze and a real nice start to a solid (price wise) bounce.

I'm looking at VXX, VIX short term futures for indications and they DID confirm the gap down (they move opposite the market), however they were negative in to Friday afternoon so we should expect that based on the way 3C behaves the next trading day or rather the way price behaves based on 3C signals the next trading day.

The 10 min VXX chart is leading negative so this is absolutely supportive of a bounce and a decent one at that.

When I say I'm looking for a bounce, I don't mean a 1 or 2-day move, I mean a pre-planned cycle, an intentional move that has a purpose, to lock retail in to long positions before the market makes the next leg lower.

At 15 mins though, VXX is in line, this is the transitional timeframe, at 30-60 min it is positive, this reflects the big picture, meaning the bounce can be strong, BUT IT HAS A ROOF ON IT OR A LID AND THE PRIMARY (BIG PICTURE) underlying tone here suggests the market's big picture trend down will resume with even more force than that of the bounce WHICH IS EXACTLY WHAT WAS EXPECTED.

So at this point this morning, I'm just trying to make sure we are still on track as HYG did throw me a bit until I saw the divergence Friday and thought about the size of positions in credit and the fact they'd take more than a day (last Friday) to turn up the size on and that can't or won't be done by smart money in to higher prices so I'm now more comfortable with the open.

Now, where to go from here.

I have a VERY speculative play I'm looking at, this is SUPER SPECULATIVE, but I may just jump on. Let me throw some more analysis and timing together and I'll bring you that if it still looks good (HUSA long) and I'll also update the other asset classes including precious metals.


Pre-Market

Futures held up well overnight except for some saber rattling in the wee-morning hours.

There was a joint US/Israeli test missile launch of two new versions of the Israeli Sparrow 2 missiles that sent Index futures a bit lower, it's not that noticeable in ES, more so in NQ.
NQ 1 min, the odd thing is that it seems someone may have been aware of the launch to come or perhaps its just coincidence that there was distribution in the hours running up to the launch.

The launch was initially detected and reported on by Russia so as far as I can tell, this seems to be either a provocation of Syria as the missiles headed to the east to the Mediterranean and fell in the sea or more likely a test of Russian capabilities as they moved a Reconnaissance ship in to the area to track any US missile launches toward Syria.

The effect was much less pronounced in ES futures, but it did spike oil briefly as well as gold and silver futures which continued to gain in to the pre-market-/ open.