Thursday, November 7, 2013

Important Market Update

I'd be hard pressed to call a top here or the resumption of the top off the 10/9 bounce cycle as I like to gather as much data as I can and it is all changing so rapidly that it's difficult to gather it all in one post without something significant having changed in the process of putting the post together.

Lets just look at the typical market update and specifically HYG as it was the method of manipulation I suspected days ago as I saw positive divergences (short term) building in High Yirld Corp. Credit, one of the most well known methods of arbitrage manipulation.

This is EXACTLY why I refused to trade around or close the leveraged short (ETF) trading positions, I learned that lesson with AAPL.

SPY
 The 1 min intraday is leading negative and in line with price, not looking good here.

The 3 min is also leading negative, the only possibility of a positive divegrence on this chart could just as easily be 3C just moving right now and in between forming a deeper negative as the indicator has not turned up and locked in a clear positive divegrence.

 The 15 min chart from the 10/9 low bounce cycle and the top process that had already started, you'll recall I expected some wide, volatile chop before the move down resumed in the averages.

For instance...
This is the meat grinding environment that was predicted...


QQQ
1 min intraday QQQ in line negative with the same positive divegrence scenario as the SPY...

The Q's and IWM as you may recall from yesterday and last night's analysis were the two that had better looking short term 3C charts and why I thought today might see a little upside in those two averages that might last half a day before heading down. As you can see though the dominant feature in the area is a leading negative divegrence.

QQQ 15 min leading negative is developing very quickly for a day or so.

QQQ 30 min and the reason why I expected that we were ar a top and the chop would likely or shortly resolve to the downside as the top looks to have clearly been put in with a leading negative divegrence on an important timeframe.

The 3 min IWM has the same possible positive divegrence, but it's hard to say until it locks in, but overall 3C has tracked and confirmed downside.

The cycle (bounce) starting with accumulation in to the 10/9 low and a leading negative divegrence in to the top area where the price reversal process is taking place and again, it looks like a positive divegrence interrupted with strong leading negative 15 min divergences like the Q's above.

The larger picture 30 min chart showing in line status for the IWM and a clear departure from that as it goes leading negative.

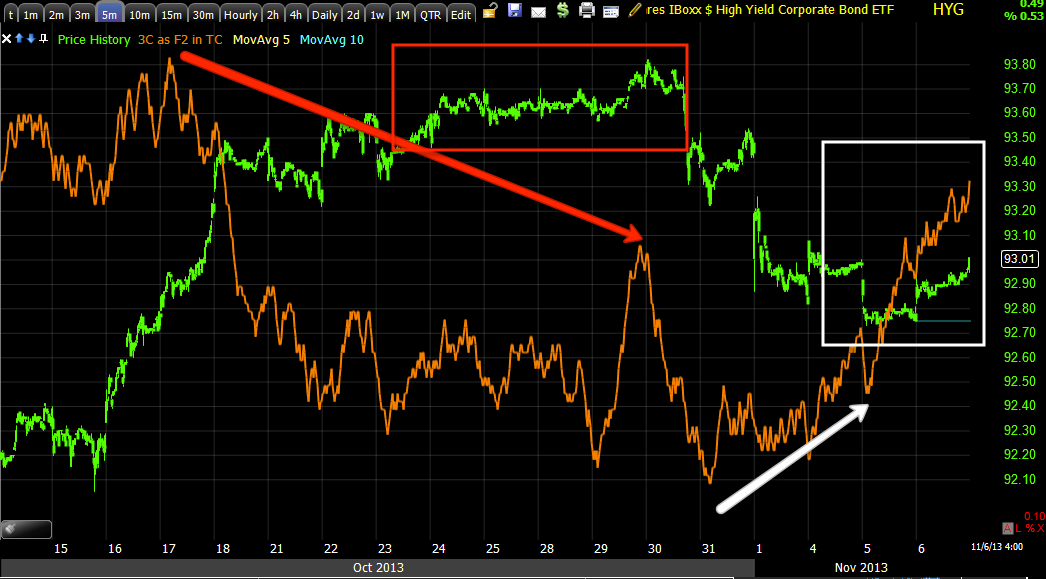
HYG, you may recall, HYG was one of the bothersome divergences forming that made me wonder if there was going to be more manipulation like yesterday's sudden Yen drop overnight sending all the carry pairs higher and futures on NO NEWS AT ALL, just low volume, easily manipulated overnight session.

The long term 30 min going from in line to leading negative, but it was the very recent activity that looked like a small bounce or counter trend move was forming at the white box.

The 15 min chart showing not only the larger distribution at the top before price turned down, but recent leading negative signals right where HYG would be expected to run higher (supporting the market) in it's "U" shaped reversal process.

The 3 min chart shows that process and the positive divegrence that I was watching closely, however that has suddenly turned leading negative.

The 1 min chart shows it the best, the rounding reversal process and accumulation causing it and then a sudden change to a negative divegrence, as if HYG suddenly saw a change of mind and whoever was trying to draw market support from credit, no longer wanted to take the risk of holding HYG.

MCP Moving Closer

If MCP keeps up at this rate, it's going to be difficult to justify not adding to the position...

 This is the 1 min chart so it is doing what I wanted to see it do.

My current thinking is as long as it doesn't move much above $4.70 which it hasn't yet), I'll let it have some more time to keep developing and the probabilities keep rising, however if I had no position in MCP at all and I was interested in it as a long, I'd say that I'd likely add the new 1/2 position now.

Typically we don't see longer term charts move this fast, when they do it tends to indicate larger underlying trade as the timeframe is longer, the possible transactions during that timeframe are much larger (accumulation) which would indicate a stepped up pace from the average rate of accumulation.

 This is the 3 min chart leading positive right at the very area we are looking at, the flat zone after the stops were hit <$4.70.

And the 5 min chart has remained in leading positive position suggesting continued accumulation of the position even as it was making irs way toward hitting the $4.70 stops. The Leading positive most recently would reflect activity at today's flat trading zone where accumulation and distribution take place most often which makes sense, think about how a market maker or specialist are graded on their work of filling a larger order, VWAP is the standard measure, so a stable VWAP in the area the client wants to establish a position is part of their job when filling orders by adjusting the spread and trying to maintain the best prices for their clients. Most technical traders aren't paying any attention to the stock anyway as it is down -3% on the day AND BELOW SUPPORT.


MCP Follow Up

MCP was entered as a half position, actually phased in starting with a half position Tuesday on the assumption that the probabilities were high (normally around 80% of all reversals have some sort of head fake move, in this case a stop run).

These are the exact words from the linked post above which was the opening of MCP as a new position Tuesday...

"As mentioned earlier, I thought MCP over and will open a partial position (long) in MCP, the risk management will leave room to add to MCP on a head fake/ Stop run move that will allow enough room in the risk management to add to MCP even if we had a stop run below the inrtraday lows of the year at $4.70."

Well the very next day our first head fake level was taken out at the $4.90 level and this morning the $4.70 level was taken out, volume pushed higher which is what we want to see.

MCP has their earnings tonight so a head fake move right before earnings is HIGHLY SUSPICIOUS AS A POSSIBLE LEAK.

I would like to see more on the intraday positive divergences, but we still have plenty of time.
 The daily chart shows the $4.70 level which was considered to be a likely head fake area and that's why I set price alerts to keep track of what's going on as certain levels are hit.

This is $4.70 on a 1 min. chart of today being taken out, note the stops hit, which is exactly what we want to see (volume up indicating that stop orders were taken out).

This is the 2 min chart nd if it were for the 2 min chart allone, I would have entered the second half of MCP yesterday, but I wanted to see the intraday 1 min go positive first and good thing because the lack of that positive divegrence led us to a new round of stops being taken out today, so I'm sticking with the 1 min chart going positive as confirmation.

While we have plenty of time intraday for that to happen, we don't have much time before earnings after the close today.

This 1 min is showing the VERY first hint of a positive divergence AND NOTE THAT IT ONLY STARTED AS THE STOPS LEVEL WAS FIRST TAKEN OUT AND PRICE FLATTENED OUT INTRADAY.

If you have 3C, keep an eye on the blue version's 1 min chart, otherwise I'd set price alerts for a move above $4.70, I'd check the volume as well, it's not as important as the stop out volume, but it can be a useful hint.

Keep MCP on your radar, this could potentially be a nice core long position and earnings leak.

More on the Knee Jerk

Again, I want to be sure if we make a trade or reaction based on a knee jerk reaction, we know that we are doing so based on a knee-jerk reaction and not just what price "appears" to tell us.

For instance, take VIX futures (a reach for protection).

Looking at the VIX alone you'd say it is depressed, complacency is high, this would normally mean you should look for a VIX move higher and market move lower, but in recent years and months, this has been taken to simply mean the market will keep heading higher.

UNDERLYING TRADE TELLS US SOMETHING VERY DIFFERENT THAT PRICE DOES NOT.

 These are the actual VIX futures, not a derivative or proxy like spot VIX or short term VIX futures like VXX (nearby forward months combined) or even the intermediate (several months a little further out combined). These are the actual futures that are used as protection from market downside.

You would not think there's real demand for the VIX futures by looking at the Spot VIX or even the daily prices of the VIX futures, but the underlying trade is telling a different story. 

Remember how flat VIX futures and even VXX or spot VIX have been when their inverse correlation suggests they should be at or making new lower lows, IT IS THAT FLAT TRADING RANGE IN VIX (and derivatives or proxies) THAT HAVE SUGGESTED ACCUMULATION UN UNDERLYING TRADE.

I mentioned this in the last two night's market wrap posts, charts like 15 min were going positive, this is the 15 min above so there's some serious underlying accumulation of VIX Futures that price alone doesn't show you.

 The 30 min chart of VIX Futures is now leading positive meaning there is LARGE underlying accumulation and very recently.

 Even the 60 min futures are showing a leading positive divegrence which in this long of a timeframe, means the underlying activity (ACCUMULATION) is quite strong, however you'd never see that demand in price alone as it seems they are trying to keep prices steady to accumulate.

 A 4 Hour VIX Futures positive divegrence is one I haven't or can't remember seeing, this is VERY STRONG accumulation activity and very recent.

However if we look at a 1 or 5 min intraday chart...
It looks a lot like price and you might never know that someone is accumulating VIX in huge amounts, someone or a bunch of someones (more likely) are getting ready for a market plunge.

These are the kinds of charts I've been looking at this morning and trying to figure out when they reacted to something specific today and why.

For instance, the better than expected GDP print would make sense to see VIX Futures accumulation as it is not QE friendly, THE F_E_D HAS A HARD TIME JUSTIFYING POMO WHEN GDP IS BEATING LIKE THAT.

However, it's what's behind the headlines like the inventories that Goldman saw and is reacting to as they lower Q4 GDP Guidance by 25%!!!

In any case, this VIX Futures strong accumulation fits very nicely with the 3C charts dealing with the most recent Cycle, deep leading negative divergences and maybe beyond (Leading Indicators and Credit VERY specifically too).

The other not so obvious issue is the VIX futures may be an outstanding short term long (VXX or UVXY long) very soon, the longer strategic charts are there, it's just the short intraday timing charts which also tells us something about the market and expected moves both intraday and intermediate and even long term trends.


Volatility Supreme

I suppose it was inevitable, quite a few things actually, but volatility was the obvious one.

As you probably know, the pundits and economists were WRONG ONCE AGAIN (actually twice if we count GDP) and the ECB did cut by 25 basis points, which as you probably figured out, sent the market higher which sent the Euro lower 150 pips almost instantly, however what I'm trrying to put together is the information behind the headlines because THAT IS WHAT THE MARKET LOOKS SET TO REACT TO AS VOLATILITY LOOKS READY TO PICK UP ONCE MORE INTRADAY.

US INITIAL CLAIMS missed, not by a lot, but for the 5th consecutive week, it didn't seem to have much effect, but when I say that I'm talking about the obvious, which is the market, it's the not so obvious I'm trying to put together and whether the headline reaction will hold with the behind the scenes information that headline scanning won't tell you about, but the market looks set to react to.

GDP was another surprise at 2.84 from 2.5 on consensus of 2.0, SO ANOTHER HUGE MISS FOR THE PUNDITS AND ECONOMISTS. While this is definitely headline TAPER ON (bad for QE), the details are what the market seems to be reacting to if you look in the right places.

What's the downside for the GDP blowout? Inventories. Goldman Sachs almost instantly lowered their Q4 GDP guidance from 2 to 1.5% which is QE friendly or "Taper OFF" and the hints of a market reaction are there.

While I don't care too much about TWTR, it's not something I want to trade on the first day, it has moved from lows of $44.99 to highs of $50.09 to a current $45.11

HERE'S A REACTION RIGHT NOW AS I TYPE, I THOUGHT THE EUR WOULD HEAD HIGHER AFTER BREAKING DOWN BECAUSE OF A POSITIVE DIVEGRENCE, IT IS RIGHT NOW.

Euro single currency futures, this is the stuff I'm looking at that isn't obvious in the market's price.

It looks like the ECB cut may have been leaked...
This positive in ES before the ECB at 7:45 was not that out of place, it looked like someone was getting ready to make an opinion based bet, but just before, the leading positive looks like a leak.


There are positives in ES, small, but there as well as some averages like SPY and a few other averages.
SPY positive.

I thought the 30 year was going to head higher and before I could even get this out it did, but I was going to also say 10 year Treasury futures DID NOT look good and they DID not move higher with the 30 year.

T's are QE sensitive and trying to figure which one is reacting and why is what I'm trying to figure out.

The $USD that popped has a negative divegrence and is now dropping as I had expected overall for near term trade (days)

I'm going to put together more specific charts because they are starting to move before I can get the posts out, but the point is, the initial reaction to the headlines seems to be giving way to the details which in some cases are VASTLY different.

I DON'T WANT TO MAKE TRADES OR TRADE MANAGEMENT ON KNEE JERK REACTIONS, EVEN IF THIS NEXT ONE (IT LOOKS LIKE UP) IS A KNEE JERK AS WELL.

Tame Overnight Session

If tonight's overnight session is compared to yesterday's, they are night and day. First we didn't have any blatant manipulation of the Yen or its carry crosses. In fact there was really only a slight rise in a EUR/JPY that was otherwise pretty flat around the European open this morning, I'm guessing that may have come from the bad print/miss in German Industrial Production coming in at -0.9 vs consensus of 0 and a previous of +1.6, so not great news there.

The $USD had a very, very slight upward drift, almost flat though. Gold drifted down a bit, oil chopped a bit to end up pretty much flat thus far, treasury futures had a very slight rise, but otherwise close to flat.

ES is at down about a point and a half from the 4 p.m. EDT print so this market has been super quiet, however the fireworks could start in as little as 15 mins when the ECB comes out with what everyone seems to think will be a "Do nothing" policy statement at 7:45 EDT.

I expect we get way more volatile as Initial Claims for the US come in as well as Q3 GDP estimate with consensus at 2%.

Then perhaps I'll limit my posts to 140 characters (I'm sure some of you would love that, I would love it if I could) in honor of the Twitter IPO. Will it do a faceplant like FaceBook did (I think that was just poorly handled by GS, Et. al.) or does it cause the rise in the market that I believe we get very short term, maybe even a partial day based on the QQQ/IWM and HYG charts (mostly), see last night's Daily Wrap for the complete 1400+ word post.

In other words, as quiet as the overnight session has been, I'd expect the rest of the day to be quite volatile starting potentially in 9 minutes with the ECB.

I'll be back in a little bit to see where we stand once all of the data points come in, have a great day.

Wednesday's Wrap

It looks to me that the Closing Market Update was right on.

If we look at the averages, what I see is a market near the top end of the chop range with significant intermediate and long term damage done.

 DIA (Dow hits new highs, but there's distribution in to the move

DIA 2 min shows it even worse

DIA 5 min makes it very clear what was going on as the Dow, the last to break cleanly above a range, does so today in to distribution.

 SPY distribution intraday as well

SPY 2 min shows the same

SPY 4 min chows the same

And the intermediate 15 min is breaking down badly here right at the top of the chop range.

 As mentioned, short term IEWM looks like it has some short term upside.

But at 15 mins there's very significant intermediate damage, I doubt any upside move can last for long.

IWM 30 min shows the same

QQQ 1 min shows a positive like there's some more upside room as mentioned before the close...

But mot a lot of room as the 4 min is already negative.

So much for momentum stocks today as the Most Shorted R3K Index plummets.
R3K MSI

Speaking of momentum, Transports see the largest decline in a month, but don't count them out yet, although I think you can very soon
IYT 5 min...

So much for Dow theory confirmation today, but after that middle of the night, horrible ramp in Yen crosses, are you really surprised that Transports strength from here is skin deep? The R2K and NDX also ended the day down, yet they are the only two that look like they have a short term, likely intraday lift left in them, but that's about it!

We were looking for a bounce in oil, largely on its own divergences, but it seems the $USDX will be helpful.

 30  min $USDX futures start to see downside as expected yesterday on a negative 30 min divergence, this should help oil, gold, GDX and likely equities, although they look like they are at the top of the chop.

USO finally starts to lift off a bottom with a 5 min leading positive and some healthy longer term charts like 30-60 min.

We had a nice double digit gain in GDX and GLD after just a few hours in the position, but decided to give them a little more room even though they are short duration positions.
 GDX should have some more upside in it before it continues a constructive pullback lower leading to an eventual long duration long position, NUGT was up almost 4% on the core long position as well as the trading position.

GLD 15 min also looks like it has more room on the upside before making the same macro moves as GDXm both should offer beautiful long term core positions as soon as their pullback continues and ends shortly after that.

Our partial long position in MCP "Should" be filled out tomorrow just before earnings at the close, we were looking for a head fake move in MCP to fill out the [position and it started that move today.
 MCP head fake move 1-day after we said we'd be looking for it? Most likely.

This 15 min positive on the shakeout is exactly what we're looking for, we just need the intraday to go positive and I'll be filling out MCP as it looks like an earnings leak is probable

And Treasuries?
 10 year 30 min is positive after 4-days of pulling back after the F_O_M_C

And TLT looks ready to bounce, our TBT short should do well

The short term TLT also looks like it is tactically ready to move.

As for the currencies, the AUD/JPY lost a lot of ground and the USD/JPY did as well, these were the carry trades ignited in the middle of the night Tues-Wed...
 ES is falling behind the EU/JPY once again, this manipulation really doesn't have more than 24 hours in it?

Now you see how they move the market when they need to, we saw an extreme example Tues-Wed. night on a no news, low volume Yen stomping.

HYG is the other asset for short term manipulation, it has been used for quite a while, but...
 HYG 5 min looks like it has some more upside like the Q's , IWM and transports, all down today...

However the 60 min chart shows the macro manipulation trend in HYG is coming to a close as it goes 60 min negative after being in line for well over a month.

 Intraday HYG saw distribution so I don't think that 5 min positive will hold out too much longer.

And protection? Just looking at the VIX you'd think there was no fear, but...

30 min VIX futures show a solid bid for protection, someone is nervous, but skillfully accumulating nice and quiet, when something goes bump in the night there will be almost no warning for those looking at price only.


Sentiment was down in to the close, not a great signal for continued gains.

High Yield Credit also closed badly in to the SPX's price action today, credit as a whole, one of the best leading indicators wants nothing to do with market upside, the credit markets see something equity markets don't see, even though they have largely been struggling (the DOW had to break above the clear range as the only average yet to do so).

Commodities also were divergent and negatively dislocated again today, even with gold and oil gains today.

I think it's very likely that the averages try to move a little bit higher, especially the IWM and NDX, but I don't think they are able to maintain long, WHICH MAY SET UP SOME NICE TRADING SHORTS TOMORROW.

I believe the Yen sees another downside move overnight, what the Euro does will depend largely on the ECB and whether they cut or not, the rumor has been no cut, but a cut would end the EUR/JPY trend, no cut would give it a little more room with HYG as well and the short term divergences in IWM/QQQ as well as the $USDX.

However I wouldn't chase any of these moves, in fact I'd be looking for the opportunity to fade them.

We should know something about the ECB in a few hours, I'm guessing the Eur/JPY moves up and the $USDX moves down, a bullish environment, but there's so much damage, it looks like it will be best used as a tactical short entry, perhaps an add to trading positions in FAZ, SRTY, SPXU, SQQQ and a few others.

I'd say don't let price scare you, I'll put the charts up when the time is right, but FAZ for instance is on the border of a nice upside move, but I think we'll get a little pullback tomorrow first, it may only last intraday.