Tuesday, October 7, 2014

Market Update

Just like the last two trades, closing the core shorts for a quick long trade on 10/1 with 3x leveraged longs and closing those out on Oct. 3rd and re-entering the 3x long shorts which are at a gain since, I'm looking in some odd spots including the 2 and 3x leveraged long and short ETFs of the averages as they often give signals earlier and stronger.

I'm seeing a little bit of accumulation in certain areas today, at intraday lows in fact, but it's not nearly enough to cause me to take any action or close our shorts even on a trading basis, but it is something. I think market breadth will tell us something more about what's happening at this level.

Here are some charts and examples, I'll have some updates on some other assets like Gold and MCP shortly.

 There were two base patterns mentioned last night, a "W" or double bottom (mini) where price comes down to last week's lows, likely hits stops below it and that's the base or an Inverse H&S -looking base, although it will NOT be as effective as a real Inverse H&S bottom.

The most important thing when dealing with H&S tops and even more so, bases, is volume confirmation. A large H&S top developed in 2010 and had traders going short, but they didn't bother to verify it being a real H&S rather than a random pattern. Volume did not confirm the H&S top and a lot of shorts were squeezed as price moved higher. A real Inverse H&S bottom needs volume confirmation even more so than a H&S top, it may be one of the most important volume confirmation price patterns.

If confirmed, they can be a real strong bottom.

This is a custom cumulative volume indicator I create to quickly judge the volume pattern. We should see increasing volume on the advances and decreasing volume on the declines and especially at the head and to the right as it gets more and more important. This is the EXACT OPPOSITE, it's decreased volume on the advances and increased volume on the declines, BUT, it looks like an inverse H&S base and as most traders don't bother to confirm, they can probably get away with it.

What's the difference if both will bounce? The quality of the bounce as one is created from human psychology and real market demand and supply, the other is a ginger bread house created by short term market manipulation.

 Intraday breadth at least saw an uptrend today and hit above +1000.

The longer term TICK shows the trend changing slightly, still early.

As for what I've seen today thus far...
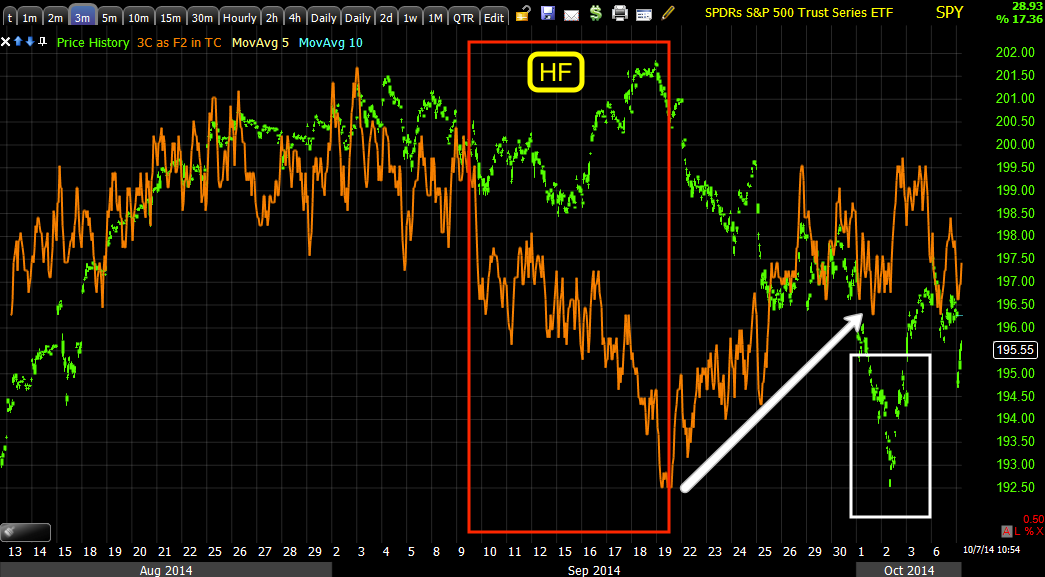
 SPY isn't doing a whole lot intraday

The 3x long, UPRO doesn't look all that good either, perhaps we are moving to last week's lows...

The 3X short SPY, SPXU on the other hand still looks strong intraday so I have no reason at all to close any short positions.

The QQQ do show a little something at or near intraday lows.

 The 3x leveraged QQQ long, TQQQ also shows some action at intraday lows so something appears to be going on, although very early in the process.

The IWM also shows an afternoon positive divegrence at a pivot low...

However if you go out to 3 mins, you can see there's no migration of the divergence, there's still a lot of work that needs to be done before we can call this a base. If anything, the chart above confirms I should continue to hold the 3x short IWM, SRTY even if I were only using it on a trading basis and not as a longer term position.

URTY, 3x long IWM just confirms the same thing.

And SRTY, the 3x short IWM, also confirms the same with a strong intraday chart.

So there's some movement, but nowhere near enough to take action other than manage the current open short positions.

As for the bigger picture, even if we do get a decent bounce off the ground, look at this SRTY 15 min chart, you'd be well justified in just sitting through the bounce and holding the 3x leveraged short, it has a very strong chart and the probabilities favor that the IWM moves lower, no matter how much we may bounce.

Market Update

Despite a plethora or perhaps a cornucopia of bad news overnight, Germany in particular with confirmed slow down and likely a triple dip recession as Industrial Production from Germany was a horror-show as well as Japan's Misery Index and all of the recent talk about a weak Yen (look for this to be a big deal, back in April of 2013 (the posts are linked on the member's site to the right called, "A Currency Crisis"), it's ironic because my forecast back then as Japan was unleashing QE-Zilla, was that the Yen would appreciate at the same time the market moves to a bear market and that is all we have been hearing out of Japan recently, "Defending the Yen", Unacceptable levels in the USD/JPY", "Weak Yen hurting consumers and small business", etc. So I think that's an ironic sign of the times as sometimes long range forecasts, broadly speaking, are easier to make.

I digress... Even with all of the bad news swirling around today including an IMF global growth forecast cut, I still think there's a very specific cycle that is being formed as the market has been doing exactly as we forecasted Friday and the SRTY/SQQQ longs (3x short IWM and QQQ) continue to work well as they were entered Friday after closing URTY and TQQQ longs (3x long QQQ and IWM) which were opened Wednesday after closing SRTY and SQQQ that same day. In essence, we have hit every minor swing in the market, but I'm looking for the evidence of first a base and second what kind of base which will help tell me what we are looking at shorter term, as in week to weeks, I know what we are looking at longer term or continuing , especially if you use the Russell 2000 as your market barometer which I think is most accurate given all the other data.

So in perusing around this morning, here are some things I noticed and you'll see that not everything is as it appears, which is why we wait for strong confirmation rather than guesses.

 My Custom SPX/RUT Ratio shows a short term (week or so) divergence between it and the SPX as it has made lower lows where the SPX has not, although that is one of the basing scenarios, a pullback in price toward the lows of last week. This indicator has been VERY accurate, it's not a Holy Grail, but it has been very effective thus far so I think, unless or until we see a strong signal saying something otherwise from this indicator, it's pretty safe to say we remain in a bearish consolidation, perhaps worse, although I'm not making that case at this moment.


 On an intraday basis it's in line with the SPX with a little recent weakness as of the capture, interestingly, since then the SPX has moved lower as the indicator was forecasting. and now near the lows of the day.

HYG (HY Corp. Credit) is in line on the day almost perfectly with the SPX.

 Taking a slightly larger view, HYG was leading the SPX and then leading it negative and now has a slight positive bias very short term.

 Taking an even wider view (this is the multiple timeframe analysis I was talking about when I said things aren't what they seem if you view the entire picture) we see HYG leading the SPX at last week's lows, it did the same at the August lows on 8/1 and led the market higher and overall it's still leading for what I would call a short term move that may be around Swing+ (week to weeks if everything plays out perfectly and as expected).


 Here's the larger view or primary trend that is essentially telling us, no matter what happens from a bounce perspective, it's just a matter of time before the market is in a full blown bear market.

HYG's 3C charts are important as well as to where it's going, how much support it will give.The 1 min chart is similar to the market averages, leading negative

The 2 min chart shows the history with a negative sending HYG lower and a positive at last week's lows sending it higher and a current negative similar to the market averages.

I'd think this would have to firm up a bit before we could look at any "potential" bounce seriously, especially trading it.

The 10 min chart shows clear distribution areas sending HYG lower and our most recent positive with a slight relative negative right now. HYG leads the market so these charts and how they develop over the next day or so will be very telling.

 Pro-sentiment Leading Indicator is in line with price so no short term help there as of now.

Yields are also pointing lower so I continue to think a pullback or more of a pullback is still in store which could be an inverse H&S pattern or "W" bottom or perhaps these divergences just give way and we head lower, this is why,  we confirm.

 TICK improved modestly today, on the upside though there's no trend, it's all on the sell side.

Intraday QQQ 1 min had a small negative this morning and that resolved with a move lower

Taking a wider view of the same 1 min QQQ chart, you can see the negative divergence is bigger than thought from the chart above.

 There's a potential 5 min positive divergence, but it's hard to give it too much weight because a lot of it's formation is due to the heavy distribution at the QQQ's August cycle top.

I do think we bounce, but I think there's still work to do to get there.

IWM 1 min in an overall leading negative divegrence...

SPY 1 min was in line

A wider view of the same chart shows the dominant divergence is in leading negative position.

And the 2 min showing distribution at the chimney (igloo top) and the first positive divegrence, but much too sharp to be a sustainable base alone.

 ES 5 min is still in leading negative position so I'll stick with the SRTY/SQQQ long (IWM and QQQ 3x short) positions until I see something that moves me to take some other action.

The 15 min chart is reasonable, the positive divegrence and the negative divegrence because any bounce is in need of a larger base, this represents what I've been forecasting since last week.

The 30 min chart shows essentially the same with a little bigger positive at the lows of last week.

However, this ends one way, the same way the long term HYG chart predicts or long term 3C charts, ES 4 hour is leading negative so this is the highest long term probability. In other words, in the absence of a bounce, we should expect moves to new cycle lows, then counter trend bounces followed by a move to a new cycle low and so on.

TICK today is mushy like yesterday without much direction, but definitely on the negative side at -1500 and solid -1250 whereas on the buy side it has only hit +1000 once or so.

I'm still looking for either an inverse H&S price pattern, I doubt it will be a real Inverse H&S or carry the effectiveness of a real Inverse H&S, or perhaps some sort of "W" or double bottom. I'll stay in the shorts until I see something SCREAMING to switch trading positions, however if I'm not a trader, then I just sit patiently in my shorts and I believe I'll be very happy for having done so. 

Monday, October 6, 2014

Daily Wrap

As we had expected based on some very nasty diveregnces at the close on Friday, today and specifically the open was weak with 3C picking up where it left off.


The early gaps up on the open like the Dow above, were immediately sold off in line with Friday's closing 3C divergences. The weakness helped Friday's SQQQ long +.55, but more so the SRTY at +2.52%.

The averages saw an early positive divegrence, it looks like it was used to sell in to VWAP intraday (SPX Futures 1 min), more on that shortly.


One divergence in particular that was noted was the $USDX, after having its best day in 15 months on Friday it saw it's biggest loss in a year today as we had mentioned the $?USD distribution in Friday's Energy post and the Daily Wrap/Week ahead post.
$USD negative divergence and worst daily loss in a year on Euro strength.

Our positions in gold and miners were up today as were broad based commodities on $USD weakness with UGLD up +3.98% and Friday's NUGT long up +7.98%.

Commodities vs. SPX (green) intraday, up on $USD weakness.

As I posted Friday, I believe we have some early week weakness that can build a bigger base as last week's base was too thin and "V" shaped to do much so we may get a bounce from that. I posted Index futures which should give you some idea, but here's another look...
 The big picture is definitely not looking good, interestingly this 60 min 3C chart of the IWM looks a lot like breadth indicators.

 The QQQ 60 min is showing the same big trouble, however from this general area, a bounce creating something like a right shoulder in the Q's and SPY/SPX below wouldn't be out of the question with a strong enough base which is what I've been talking about and why I moved back in to core shorts until/unless the market proves it to me.

SPX 4 hour leading negative divegrence.

 Locally , other than a double bottom, an Inverse H&S base is possible too, although I doubt it would be a real base with appropriate volume, rather a cardboard man as most traders don't know how to verify an Inverse H&S base.

I have marked a left shoulder a head and the current negative divegrence (this is how IWM closed on the 1 min leading negative), could create a right shoulder or a double bottom.

 As you can see, there's still a lot of weakness in the IWM chart especially so I'll hold the shorts re-entered Friday, specifically SQQQ and SRTY.

Looking at a 30 min ES/SPX Futures 3C chart, you can also imagine an Inverse H&S forming, it has the divergence for the head, it needs a right shoulder/pullback.

The 5 min ES chart suggests that's exactly what's going to happen, at least the pullback or move down part.

Russell 2000 Futures have the same deep leading negative divergence.

The QQQ Futures do too, but they look the best on a relative basis,  so we'll let the market prove it to us, otherwise, I'm content to stick with the shorts and add where we can. If we can play a H&S top, right shoulder bounce after a stronger base is created, I'll take that too, but we are not there yet, just something to consider.

As for Leading Indicators, HYG stayed with price today, but remains in short term leading position and long term leading negative position.

Pro-Sentiment indicators are biased slightly toward leading positive, but not by much. Yields did what they were expected to and pulled the market lower toward them as they most often do.

HY Credit remained "supportive " today, not leading, but still in good position overall to be supportive if the market can put together a small base,  again, we'll let the market prove it and decide if it's worth the risk, so far the trades and signals have been spot on.

The SPY/RUT Ratio Indicator is quickly becoming one of my favorite leading indicators and here's what it has to say about near term price action...
On a short term basis it is saying what 3C is saying, it is not confirming price in the area, but rather suggesting a pullback toward last week's lows which is what I initially was thinking, if we see that, we can verify accumulation with 3C and tell whether it's a base for a bounce or likely to just slide to the downside more.

Our MCP long today was also of interest, putting in a +8.09% gain on volume as we have recently covered its rounding bottom behavior.

As for internals... Among breadth indicators there was virtually NO movement today, almost a wash and I saw quite a bit of that in TICK as well with very wide swings, +/-1250 not uncommon.

The Dominant Price/Volume Relationship was Close Down/Volume Down with 15 of the Dow, 48 of the NASDAQ 100, 729 of the Russell 2000 and 241 of the S&P-500.

There's no strong next day relationship with this one, I call it, "Carry on" as the market tends to do what it was doing so I would suppose moderate weakness? The market breadth definitely wasn't oversold today.

Of the 9 S&P sectors, 3 closed green with Energy leading @ +.11%, barely a move and Consumer Discretionary lagging at -.59%, again, barely a move. Of the 238 Morningstar Industry/Sub-Industry groups, 56 of 238 were green, a bit on the oversold side, but nothing like last week's extremes.

My opinion of the market going forward this week hasn't changed at all from Friday's The Daily Wrap and the Week Ahead or anything that I posted today.

On an interesting side-note, I've created a new scanning indicator for the major averages, based on their 50-day and 200-day moving averages for their component stocks that make up each average. Here are some interesting findings...

57.1% of the Dow component stocks are above their 50-day moving average leaving approximately 43% under. About half of the NASDAQ 100 are under their 50-day moving average and Only 23% of Russell 2000 stocks are above their 50-day moving average! Less than half of the SPX's component stocks are above their 50-day moving average...