Tuesday, March 17, 2015

Leading Indicators and Perhaps a Surprising Change in Dollar Direction

These Leading Indicators were captured before the last post, I was going to put this out first so the charts are as close to the capture time as possible, but in most cases, it's not a big deal.

Lets just jump in.

 Our SPX:RUT Ratio which called a base/bottom for a bounce and has since gone negative, this may be partially on the broad market or specifically on the IWM or a blend of the two, either way, the indicator has had a solid track record and while not SCREAMING negative yet, there's certainly a change for the positive divergence earlier.

 As I've mentioned numerous times, one of the first places I look for divergences is in HYG / High Yield Corporate Credit as it will lead a bounce and it will lead a decline and the divergences will tell us before the price divegrence with the market which is the actual trigger, Here at the top or stage 3 of the February cycle, HYG led the market lower and in to the recent SPX base (W-like), it has been somewhat supportive, but since the SPX "seems" to have missed the bounce last week with the Russell 2000, there's a clear and obviously negative price divergence between HYG (blue) and the SPX (green). This does not bode well for the market.

A closer look at the base area for HYG/SPX shows the same, it's the negative divergence to the right (red) which is problematic for the market as a whole, this is risk off. Credit is not following equities mini-bounce/exuberance.

 Intraday I showed earlier how HYG was being used to lift the SPX , but even that has failed at this point with both assets red and HYG diverging to the downside intraday.

High Yield Credit which is less prone to the manipulation or ramping that HYG is also shows the February cycle and just before with HY Credit leading to the downside before the Feb. base and then in line through the rest of the cycle, but leading negative now along with all HY Credit.

This is a closer look at HY Credit vs the SPX and the in line status at the green arrows, slightly positive at the white and negative at the red, the current leading negative divegrence is the path of highest probabilities for the board market here.

FXE used as a proxy for the Euro (orange) vs the SPX (green)...
 Recently the EUR/USD has been the go-to FX pair as it was years ago before the JPY based carry trades took over and it is once again at least recently. You can see the correlation between the Euro and the SPX, or you might say the $USD (which largely moves opposite the Euro) and the SPX.

Here at this moment to the far right, as I pointed out last night, the market ran past the EUR/USD correlation that had been holding, this morning and overnight futures knocked lower and EUR/USd a bit higher, but they reverted back to the mean, the correlation.

 On a closer intraday basis, you can see that overshoot in the broad market yesterday in the yellow box, the problem is the neither the  Euro nor the EUR/USD were in line with the move leaving the futures exposed and without support of the tight cross asset correlation that has been driving the market at least the last week and a half. This continues to be a negative development/signal for the broad market.

The $USD legacy arbitrage runs opposite equities, commodities and really anything that is $US dollar denominated like oil and gold. Here I've inverted the $USD price (using UUP as a proxy) vs the SPX, so in a normal situation, the two should move exactly together as they actually move opposite each other, but because I inverted the UUP price, it is easier to see changes in relative performance and they should track together.

 At the top of the February cycle you can see the $USD or UUP on the chart appears to turn down and the market should follow that, in reality it is turning up as the two have an inverse correlation, this is just for viewing purposes. At the move yesterday in to the close as mentioned above, the market had no support from the Euro, the USD or the EUR/USD which I pointed out as I suspected it would be a problem. Even with that problem and futures lower overnight, there's still a significant divegrence in which the $USD will not confirm market strength here from yesterday afternoon.

 A closer look shows several divergences , but the most noteworthy right now is in yellow, again from yesterday.

 This is the intraday 3C chart of EUR/USD as you can see there have been several divergences, this is as of about an hour ago so there are some slight differences with the FX pair a bit lower, pressuring the market a bit lower with it.

 This is TLT in blue vs the SPX, normally the correlation is typically inverse or opposite so when looking at the February cycle with stage 2 at "2" you can see TLT moving lower or bonds lower meaning yields higher which is supportive of the early stage 2 mark up as it should be in this area. At the next red area TLT is moving up meaning yields as a leading indicator are moving down and pressuring the SPX lower , soon we have a top and transition to stage 4 decline. Again in white TLT is falling, meaning yields are rising which is supportive of something like a market bounce as we put together other pieces of the puzzle and to the right we see the small base, it's just it almost looks like it missed the train last week with the Russell 2000 and now TLT is moving up again, yields down pressuring the broad market lower.

 Hear are actual 30 year yields in red, I could have used 10 year or 5 year and the outcome would have been the dame. Yields move up in early stage 2 mark up just as TLT above shows, then go negative and do not confirm at the stage 3 top, soon the SPX is in stage 4 decline and retraces the entire head fake move. The Non-Farm Payrolls on March 6th send bonds lower/yields higher and I pointed this out last week as the market has a positive pull on it as yields remained higher than the correlation with SPX, but since then, the two have reverted to the mean, actually as of yesterday since the March 6th Non-Farm Payrolls move in bonds.

That return to the mean is in yellow, thus the positive divergence in yields , helpful to the broad market is now gone. The R2K got to take advantage of it last week, but for the SPY/QQQ/DOW, the advantage is gone.

Here on an intraday chart you can see yields were slightly supportive at the SPX lows and accumulation areas that formed a small "W" like base, however since then, yields are leading lower and act like a magnet for equity prices, exerting downward gravitational pull on prices. All in all, nothing above looks good for the broad market near term.

 Just to show you there's no difference, this is the same chart using 10 year yields rather than 30 and the outcome is the same, they are not confirming the SPX in green, but leading lower.

 Looking at VXX, Short term VIX futures on a 5 min chart vs the SPX in green covering the entire Feb. cycle, this is the correlation without any inversion, it is roughly mirror opposite, yet VXX looks like it has either formed a flat base that could be accumulated expecting lower prices in the broad market or it is simply underperforming.

The charts for VXX such as the following suggest it has been under accumulation expecting a large, broad move lower in the averages.
 VXX (Short Term VIX Futures) on a respectable 15 min chart are leading positive, the lack of upside that we'd normally expect to see as the market turned down at stage 4, looks more like VXX is putting together a larger base, expecting a bigger move than normal in the market to the downside and up in VIX based products.

UVXY which I closed at 10% gain on Friday anticipating some downdraft, is the 32x leveraged long ETF, but just because prices move according to the 2x leverage doesn't mean demand and volume are the same, thus 3C which is based on volume as well, would not give a confirming signal if it weren't there. Quite simply, while the ETF managers have to do their best to match the 1-day price move and keep the correlation, they don't control volume and volume is often a sign o demand or supply. The bottom line is this 30 min (longer) chart of the same product with 2x leverage confirms the chart above with a huge leading positive divegrence so YES, I do want to re-open the UVXY long.

This is the entire February cycle, you can see the start at 1/29-2/2 and the chart is XIV which is the inverse of VXX or SHORT VIX short term futures and as such, it moves WITH the market, thus the staging you see is the same as the market, stage 1, 2, 3, and 4. The confirmation you see at the green arrow at stage 2 on this longer 60 min chart confirms the same thing seen above on the 15 min VXX or 30 min UVXY chart. The leading negative divegrence confirms not only the VIX based ETFs above, but the broad market itself and the current bounce attempt is still seeing a deep leading negative 3C position like the averages, ETFs , VIX futures, HYG, and on and on.

 This is a short term 5 min chart (intraday) of VXX and I have inverted SPX's price and left the VXX's price alone so you can see what should be the normal correlation. At the red area, VXX should be matching the SPX's price, however it's flat like a ranging base-forming price pattern and you can see the positive divergences above. Again, I suspect a large VXX long position is being put on in anticipation of a move much lower in the broad market, but this isn't news.

 Here's the reason I closed UVXY on Friday, again SPX prices in green are inverted so the two top looking structures are actually bottom "W" base price formations.  As the SPX moved lower Friday (higher on this chart because of the price inversion), VXX should have moved higher, but it didn't, this is why I suspected it wasn't done building a base and I might as well take the gains off the table and add the position back at better prices and better timing before it takes off to the upside,

 Here's the pair intraday, again the SPX is inverted so the 11 a.m. highs on this chart are really the SPX's 11 a.m. lows, this is about when the lever pulling on HYG, VXX and TLT began. At the red area which are SPX intraday lows, VXX fails to make the highs it should have made and was already seeing intraday 3C divergences to pull it lower in an attempt to ramp the market. Again around 1 pm VXX underperforms the correlation and continues to right in to the close, yet the SPX closes red and on volume.

This is a chart of the pair intraday without any price inversion, SPY is green, VXX is red.
Even using the VXX lever and the HYG lever, the SPX still can't close green and there's some pretty large volume on the close.

Even in to the close with VXX moving lower, it and UVXY see intraday accumulation lower and XIV which is moving up sees intraday distribution, again another negative signal for the market overall here.


Commodities as I have shown, after years of distortion because of QE, are acting as a leading indicator again and I suspect right now it's based on global macro economics. There's no inversion in prices, commodities are brown, the SPX is green, This 5 min chart shows the area of accumulation in commodities to the far right which is January 29th through Feb. 2nd, or otherwise as widely confirmed in nearly every asset we've looked at, the base/accumulation area for the February cycle. There are some additional divergences to the left just so you can see commodities are working again as a leading indicator. Note the positive divegrence between commodities and the SPX at the base lows in which commodities lead just before stage 2 mark up is git in the SPX?
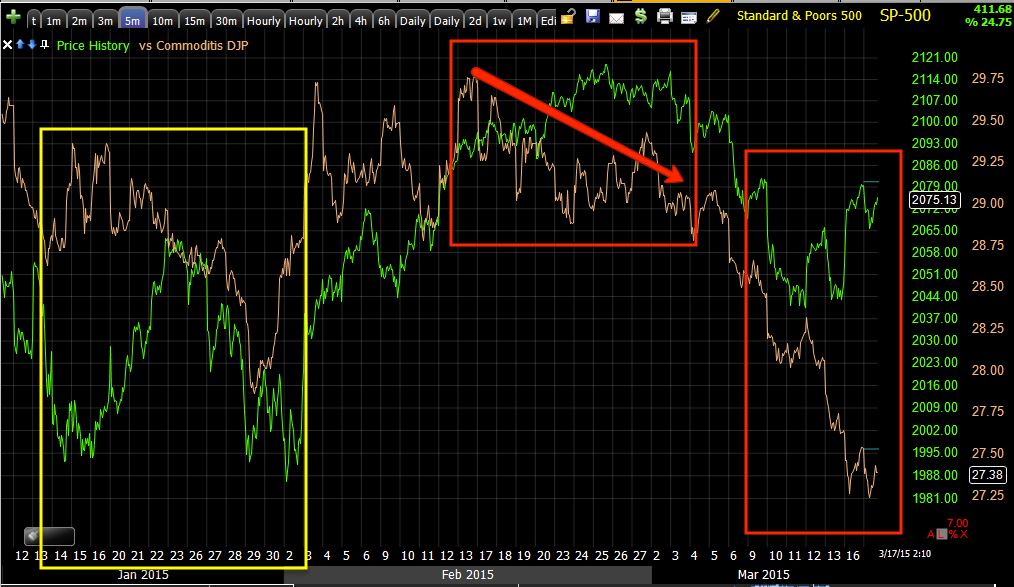

 Along the same lines, the area I just showed you is the same area highlighted in yellow on the chart above, this is the February cycle with commodities calling the bottom, calling the stage 3 top and right now, calling a leading divergence or dislocation with the SPX, essentially a leading negative SPX divergence.

On a closer basis looking at the recent bounce base, commodities are leading and confirming the SPX's stage 4 decline until the base area for SPX where commodities are a bit higher and supportive, but it looks like since the SPX missed the rally last week with the Russell 2000, commodities have slipped lower as you've already seen above and are leading the SPX lower just as they led it higher in the Feb. cycle, confirmed at stage 2, led lower at stage 3 top and confirmed at the stage 4 decline.

They've had an amazing track record here without a single flaw and now they are pointing  at lower prices for the major averages.

Here's where things get strange and I don't have the answer why.
 This is the EUR/USD 3C divergences today, they were not helpful to the market, in fact the market defied them again...
 Es (purple) vs EUR/USD once again closing above the EUR/USD correlation, as ES did yesterday leading to the overnight downdraft until they reverted to the mean.

This shows yesterday's close above the correlation (correlation can be seen to the left) and again today on a much weaker market.


However when I look at the pair using the single currency futures of EUR and $USDX, I come up with something interesting...
 The 30 min $USDX chart has a negative divegrence suggesting the $USD see some downside pretty soon despite the relentless upside it has been trending in.

Matching the divegrence is the Euro with a 30 min positive divegrence.

If we took these two together it would point to a move higher in EUR/USD, by correlation that would mean the broad market as well, the only problem is everything else above is arguing with this theory. We do have to remember that the EUR/USD correlation is rather new, I'm not sure we can expect it to last forever.

Another explanation may be the slow pace of QE in the EU as it has been widely expected the ECB would not have enough assets to monetize and their QE would be much smaller than anticipated. In addition, the $USD's dominance is being challenged by China's AIIB which US allies have recently joined including Great Britain, Australia is to join, Germany, France and Italy are also to join despite US pressure not to do so. This Chinese led International Development Bank will compete directly with the Washington based World Bank and will threaten the $USD's dominance as the World's reserve currency, so this may be on the charts as well given the recent string of US allies to leave the US o the side of the road and join China.

 This 30 min chart of the $USD vs the SPX futures shows the inverse correlation, so even without an EUR/USD move, the $USD negative divegrence suggests a move higher in the Index futures, except everything above argues against that.

So I'm not really sure what we are looking at here and why, but it's on a 30 min chart thus far and must mean something for $USD led strength. Whether it effects the equity market, I'd suspect it would have some positive effect on oil and gold, both of which we see as being in a consolidation/pullback/accumulation area.

This is the 60 min 3C chart of the $USD, not quite as strong as the 30 min so maybe something changes, but I could not ignore it.

This is the 60 min Euro chart, while a slight positive, nowhere near as strong as the Euro, for that reason, I doubt this is a leak about the F_E_D which would imply a VERY dovish stance taken tomorrow.

The fact is, I'm not sure what it's about or how long it might last and if it triggers, it's just something I can't just leave out there, but whether it's ECB related, EU related (Greece), $US related or even China related, it seems to be pointing to something that pulls the dollar down at least short term.

Other than that, just about every chart we can look at for leading indications and cross asset correlations confirms each other and they are all negative for the market.

More to come in the Daily Wrap shortly.

Quick Market Update

I've been gathering charts for a Leading Indicators update which at this point we might as well call cross asset correlation update as that seems to be the dominant force. I wanted to show the averages quickly before I started putting the post together (I have all the charts captured, hopefully they'll still be relevant at the time of the post), but there's one thing I need to read up on in the news right now that may explain a few things which would relate not only to currencies, but to equities, gold, commodities in general and oil specifically.

This could be a rather complicated issue, but has to do with recent developments over the last couple of days so I'll get that out ASAP.

As for the averages, the gas in the tank scenario hasn't changed much , which means SPY and QQQ really didn't get too much in to the green to offer the ability to sell in to higher prices. It's not just about higher prices, but about sentiment at the moment, if there's no demand and you are putting not a full size position, but a fairly large chunk out there, without demand which comes with higher prices, you usually get a bad fill which can be all the difference between a profitable trade and a loss. At the same time the IWM pretty much spent its fuel coming in to this week as we forecasted with a rotation from IWM to QQQ/SPY which was seen yesterday as they doubled the IWM's performance, a mirror reversal from last week.

As for the averages, a lot of little levers were pulled, HYG, TLT, VXX, etc, but the ones that have shown such strong correlation through last week are still in effect this week so far and in what I'd call a change in character, for the first time in a long time, these assets are beating out the typical market ramping levers even on a short term intraday basis.

 SPY 1 min intraday has lost some of that earlier shine.

SPY 2 min is weakening as we speak. The ramping levers were tried earlier and they didn't get too far, I suspect its one of the same two options mentioned earlier, 1) the Cross asset correlation is too strong even for the ramping levers and or traders are unwilling to put out the risk needed to maintain the ramping levers like buying HYG, selling VIX futures (protection), etc.

Or #2 was the same concept we saw in to NFLX earnings which stunk, but the market action which is nearly speed of light now with HFT defines the perception of earnings long before anyone can actually read what happened. We read what happened and knew it was a perception set up to allow middle men to get out of losing positions on a previous big gap down, thus NFLX was a trade set up that we were just looking for an entry as we knew the price reaction was bunk all created by price perception rather than the horrible earnings which led us to a NFLX short position on Feb. 26th at the highest highs, the best entry you could possibly ask for, but the set up was started the day after earnings came out on the big gap up.

That's the second possibility that the market is set for an F_O_M_C perception rally. My argument against this is the IWM was out of gas last week, the rotation among market averages is not healthy market action and nearly every leading indicator is against the idea and instead pointing lower and we have seen some signs of early panic. It's a possibility and we ALWAYS expect some kind of knee jerk reaction on anything F_E_D related and we know that these knee jerks are almost always wrong.

That was the second possibility I put out, I just don't see the evidence in that corner like I do in the original simple bounce before the F_O_M_C.


 The SPY 10 min chart is still intact, not a surprise as there has been nothing to sell in to, not just a lack of price strength, but demand that would support a decent fill on a larger than 100-lot order.

 The QQQ's earlier short squeeze looking move has lost its divegrence which is going negative intraday here.

 While the 5 min chart does have a negative divergence started, it's not far enough along yet that I would say, "Let's re-open QQQ puts here".

 The QQQ 10 min and bounce base, with an early morning sign of some panic before they got a little lever inspired upside intraday.

The IWM other than being negative at the close yesterday is in line intraday, however the same chart on a trend basis looks very different.

?Here it goes from positive to in line at the bounce to leading negative in to price strength.

The IWM 10 min chart has a good amount of damage, but I'd still rather wait on any new positions there until SPY and QQQ clear up and/or IWM grows an even worse divergence.

I'll have Leading Indicators or Cross Asset Correlations out soon, which were textbook last week to the point in which I don't recall the last time I ever saw them so correlated and effective.


Market and Levers Hook Up

I mentioned the HYG volume earlier and the probability of an intraday "V" shaped move in HYG as it's the go to lever when you need to move the market although this is FAR, FAR removed from any realistic lasting HYG base/support area, it looks like a short term stop-gap measure.

 SPY in green, HYG intraday in red, they've hooked up and are nearly in perfect lock sync.

The QQQ loks like a different story, I don't think it's AAPL, it's not biotechs, but what it does look like is a textbook short squeeze...
See the diagonal trendline with no corrections and low volume, those are the hallmarks of a short squeeze.

NASDAQ Bios aren't behind it, they are actually not looking great right now.

It's not just HYG, but TLT and VXX too, but these are very small, sudden intraday divergences,  it wreaks of panic to get the averages green and you know why I think that is, to give them something to sell in to, but that's a theory and I'm open to others, however looking at everything, it just looks like that's the most likely interpretation as EURR/USD still is not cooperating.
 TLT has a 2 min negative intraday, that's about as far as it goes. Remember bond prices go down, yields go up and equities are drawn to yields.


 As you can see at the 5 min TLT chart things are perfectly in line so this intraday divegrence on the 2 min chart above looks a little like panic, which I suggested we might just see with that much gas in the tank and nothing to sell in to.

The 3rd asset in the typical lever called SPY Arbitrage is VXX, short term VIX futures. Earlier I showed you their chart and showsd they were building, but not quite where I wanted to replace the UVXY position yet, that was a good choice. This is VXX 1 min, again a very short term intraday chart and a very recent negative divegrence which if sending VXX lower helps the market, which looks like it needs all the help it can get at this immediate moment.


If this is the best the SPY can do for even an intraday positive divergence, it's going to need every penny it can squeeze out of HYG as well as the others and maybe then some.
 a 1 min leading positive ONLY on the SPY.

The Q's aren't any better with an in line chat on the 1 min intraday, not even leading.

And at the 10 min QQQ that saw some earlier damage, it's not totally fallen apart, but it's not far from a couple of good hits and it may just do that.

As for the IWM, this is the intraday tend from strong to rotating out yesterday and leading negative, it looks like it has spent all of its gas and is just waiting around to see if it can draft or not.

The 15 min IWM already has some decent damage and this is probably what I'll be looking at for additional signals before making a decision about IWM puts or other short positions mentioned last night.

 Again, in my last post I mentioned possible desperation and panic, this looks a lot like it in trying to get out of some positions from earlier in the week (partly last week) on a short term , small base/bounce position.

It's very interesting how strong the multiple asset correlation has been. I think this may be the key and am trying to divide my time between watching the market and tone, seeing what's moving it and how long it can hold out and what opportunities are available and if this is the right time to take a swing at them.

Very interesting day from my perspective.


Market Update

I have written this post approximately 4 times now since the open.

First, here's a look at the price-chasing herd mentality, it's no wonder most traders are on the losing side of the trade as they chase price at the worst possible points.
 On the cash open the NYSE TICK Index saw a massive extreme of -1530, that's a ton of sellers all based on the futures, just chasing price or reacting to short term price swings.

The overall TICK data for the day is on the weak side, the opposite of yesterday with quite a few forays below the -1000 level and not much above the +500 level (TICK= the number of advancing NYSE issues minus the declining issues for each bar).

I've been trying to put together this morning, how much gas is in the tank for each of the averages and at what rate they are burning it, but I keep getting some unexpected surprises before I can get a post complete.

 As near as I can tell, this 30 min ES chart is the "gas in the tank", it's still pretty substantial, but so was TF (Russell 200) and it burned off quickly.

The NASDAQ 1000 futures show what they have on this 15 min chart.

And the decline in TF/Russell 2000 as there was selling in to strength all of last week is seen on this 30 min chart.

There are some potential movers and game changers, but thus far since the open, EU?R/USD has been weak, I'll put out a post more specific to that FX pair to help with guidance. This weakness has in turn been pushing on the averages and without higher prices in the SPY and QQQ, there's not much to sell in to, although there is some as we are at least out of the base.

HYG gapped down so from a price point of view, it is leading the market lower, but look at it intraday and see if you notice what I do...
That's another ugly gap down on this 10 min HYG chart this morning, but remember the importance f volume analysis and what higher volume in a situation like this typically means, typically it is not selling that takes the asset lower as Technical analysis would have you believe, but rather short term capitulation. This being on a 10 min chart would be very short term, but enough to bounce HYG and maybe the market, that may be the goal since EUR/USD is not cooperating to a large extent, at least not right now.

As for VIX futures, they have one of the cleanest, clearest charts that tells me that our forecast of stage 4 decline continuing after this "NORMAL" bounce is the highest probability.

 This is VXX 30 min leading positive, a strong chart suggesting the market move as strongly in the opposite direction.

A more detailed view is available on this 15 min chart, a nice flat base area ad a nice leading positive divegrence through it, although this really has nothing to do with the market bounce, this is a bigger picture of what comes next.

Remember Friday I closed the 2x long leveraged version of VXX, UUVXY on what I saw as a pullback. This 2 min chart shows the area where it was closed at the yellow arrow and while this chart doesn't show the timing reason why, there is /was one as well as a bigger reason as far as near term trade.

So do I want to add UVXY back? Yes, but with this being the extent of the accumulation since the pullback on a 1 min chart, even though it's part of a much larger base, I don't think we are there yet.

HYG has a decent probability of bouncing intraday on a "V" shaped move which is not a strong move or a lasting one, but if you need the market higher in the next day or before tomorrow, that would be of assistance, it is just the cross asset correlation has been so strong, you saw what happened to futures overnight as they ran above their E?UR/USD correlation, they were snapped right back down to it so can HYG do it on its own if it even does it? I'm guessing they need higher or at least stabilized prices or they may risk a panic sell-off with that much gas still in the tank and so little time before tomorrow's F_O_M_C unless as I mentioned earlier this week, that the divergence is a tool for creating perception, which I said I'd look for evidence of that, I haven't found that as of now, what I've found is the cross asset correlations working over the averages thus far.

As far as how deep we've dug in to the distribution phase or burned gas in the tank, that's been the difficult part.

I see some signals that look a bit like some panic selling is going on and I don't mean the ridiculous TICK reading at the open, that was retail scared out of positions because of the overnight futures.

Using the SPY as an example...
 Yesterday the intraday chart of SPY showed distribution in to higher prices, it was the first time in a week the SPY had made higher prices to sell in to, I believe at the end of the day there was an effort to support the SPY kind of like a vampire drinking the blood of its victim, but stopping short of killing them so they'd be able to do it again, you'll see below. Sorry for the horrible analogy.

You can see the 3 min SPY base easily and the mark up phase as well as a distribution phase and later in the day some lighter support , laying off the distribution a bit to try to get the SPY higher to sell in to again today, but that didn't seem to work, partly because of the correlation with EUR/USD which it over ran yesterday as pointed out and while I haven't connected all of the dots, I'm sure it's not the only cross asset correlation that was divergent.

The 5 min SPY shows the same, early distribution, later attempts to send it higher to do it all over again and we even saw this in a few of the leading indicators at the close like Spot VIX. However again, it doesn't seem to have worked.

That leaves this 10 min SPY chart as the picture of "Gas in the tank". This is why I say, with that much still there, if they need to get out before the F_O_M_C tomorrow, we may see some professional panic selling. The other possibility mentioned earlier (yesterday or Friday I believe) is that the divergence is there as a NFLX pre-earning's divegrence to set perception via market reaction, although I don't think this is what's going on just because of the attempts and failures with cross asset correlation being as perfect as I've ever seen last week and that being the culprit this morning.

There appear to be some signs of this in the Q's, the IWM makes this much more difficult because of the rotation from yesterday, it's not a great confirming asset being it has blown through its tank of gas.


 The QQQ hasn't shown the same kind of intraday distribution yesterday as the SPY did, that wouldn't be a surprise with the market obviously not caring or not able to control the dispersion between the averages and their relative performance issues. I suspect they were waiting on the Q's for today, expecting the AAPL TV business would lift the Q's higher, but it seems the cross asset correlation is even stronger.

This is a 10 min chart with QQQ distribution and the gas in the tank for the bounce, but note what looks like a panic sell today, I'll show you closer.

This is the same QQQ 10 min chart just zoomed in, it seems to have a large distribution chunk showing up on a 10 min chart which means it would not be a process that runs through the 1min and then 2 min timeframe, etc., but rather a large chunk all at once, more of a panic than a distribution process.

If I am correct, "if", then we may just see a lot more of this if they can't get the market higher using some of the levers.

This is what I've been looking at this morning and it all started late yesterday when the averages ran past their correlation with EUR/USd which has numerous correlations with numerous other assets, as you saw, they nearly reverted down to the mean with overnight futures action.

This seems to be the driving force, this could get interesting in a hurry, but I have to keep an open mind and consider other possibilities too. For now I'd just say there's a good deal of gas in the tank to potentially take the market higher, it may be that asset correlations prevent that and if that's the case, then I'd suspect there's going to be some large chunk panic selling rather than a distribution process.

A.M. Update

Overnight and in to this morning futures have declined, a certain risk-offness perhaps due to the Bank of Japan standing pat and deciding there will be no additional asset purchases at this time and CPI will return to 2% sometime this year or next as soon as the low oil move ends.

Of course it could be from your pick of disappointing economic data such as the German ZEW survey or new housing starts, and while it does look like the ZEW may have played a role in the overnight decline...
 ES overnight with a negative divegrence about an hour after the European open.

I think it's far more likely this has to do with the high cross asset correlation and the EUR/USD in particular.
 But wait a minute, the EUR/USD is higher this morning! What gives?

TRemember yesterday I pointed out ES futures in purple had run past the EUR/USD correlation, well overnight they simply ran down to it as it pushed up to ES, right now they are nearly perfectly in line with a slight edge to EUR/USD, I suspect on the open we'll see a pop higher, this market isn't out of gas quite yet except maybe the R2K.

Monday, March 16, 2015

Daily Wrap

Hindenburg Omen once again! That's probably tour TA headline for the day after a 2 month hiatus, it makes sense with the rotation out of Russell 2000 and in to the other averages which all closed right around +1.29% (Dow and NDX) with the SPX at +1.35%, in other words, they tracked almost exactly alike as the averages should usually do, but just as the Russell 2000 way outperformed the SPX/NDX last week, as anticipated and forecasted for this week, it halved their performance today at +.62%, still a respectable gain on the day, but if there's any question as to why there's a Hindenburg Omen, you don't have to look too much further than the performance of the major averages on a daily price percentage relative basis. The SPX and NDX (as well as Dow) rotated in, Russell 2000 rotated out as we expected early this week.

While the SPX is just now exiting its base area and thus is giving the market something to sell in to, we are already seeing distribution which was evident on futures charts as well as the averages themselves.

From left to right on the SPY intraday chart, Monday the 9th's "early week price strength " with distribution down to Tuesday's lows where we closed AAPL and QQQ puts on signs of a base/bounce building that would effect time sensitive options, especially these which had a March 20th expiration, gains of 22% and 48% were taken off the table in the two positions, AAPL Update and AAPL/QQQ P/L Next we have the building of the divergence which formed a "W" like base and today being the first day outside that base since last week, you can see the intraday negative divegrence. Still, if I had to pick a target on the upside and the F_O_M_C starting tomorrow through Wednesday wasn't a consideration, I'd say $210-$211 for the SPY.

ES/SPX futures have lost about 12 points since the cash close at 4 p.m. today.

The QQQ looked a bit better and both have a full tank of gas considering the divegrence...
QQQ positive divegrence last week with a head fake move/stop run Friday and not too heavy of distribution today. I'd say $107.60 is an easy target and $108+ is likely. NASDAQ Futures have given up about -.30% since hitting their intraday highs for the new week right around the close.

Price action today wasn't at all about a short squeeze as the Most Shorted Index closed virtually unchanged, but as the Hindenburg Omen tells us, the market is a bit confused internally as far as new highs/lows and advancers/decliners, it doesn't look as it should and I suspect the R2K rotation has a big part to play in that.

The IWM intraday was a very different reality...
However you already know this from the last post and really this shouldn't be a surprise at al as we have been forecasting it for several days and have had proof on Friday or lets say objective evidence, still forecasting market relative performance divergences this big is not a usual event, thus what we've seen has been very real and a bit uncommon and not healthy for a market at all, thus the Hindenburg Omen as additional proof. Still, the IWM had a full tank of gas and ran out, the SPY/QQ should be no different and I still suspect they move up right in to the F_O_M_C at 2 p.m. on Wednesday or thereabouts.


Right now barely 50% of Russell 2000 stocks are above their 50/200 day moving averages, hows that for breadth!

Since our last Leading Indicators and Perspective update this afternoon, EUR/USD which had a high degree of correlation with Index futures (as did nearly all assets last week) has dislocated a bit along the lines of the divergence in EUR/USD which is pretty close to in line right now.

EUR/USD (candlesticks) vs ES purple on a 5 min chart shows some dislocation.

As for Leading Indicators since the last update, the Pro sentiment Indicator has deteriorated a bit more intraday, our SPX:RUT ratio has seen a bit more deterioration, although not that much worse than this afternoon. HYG/HY credit remains divergent with equities, although still maintains a small positive divegrence. In fact High Yield Credit overall was not performing well today, just another aspect showing the risk on mentality is fractured not only in HY credit, but the very leader of risk on, the Russell 2000.

 VXX which was weak over a period of a couple days at the two SPX relative lows last week repaired a bit in to the end of the day with the last hour, although spot VIX which was in line intraday saw some deterioration just in the last 14 mins of trade, like it was whacked to push the markets higher at the close.

TLT pushed higher the last 60 mins which would send yields lower although the bond market closes at 3 p.m. Of course there's a stronger divergence between the Euro vs SPX and the $USD vs SPX because of the relative weakness later in the day in EUR/USD which was forecasted on intraday 3C charts.

This is what 20+ year yields would have looked like intraday in to the last hour which is somewhat interesting...The typical levers for the market are not working together, but against one and another.

TLT inverted to show what 20+ year yields would have looked like the last hour, pulling away from equities.

Point of fact, beyond what was already covered in the updates today and above, there really isn't any smoking gun other than in the IWM that suggests anything other than what our forecast was for this week in to the F_O_M_C, which was for the SPy and QQQ to rotate in and IWM to rotate out and this to continue in to the F_O_M_C Wednesday at 2 p.m. or thereabouts, although I'll keep my eye on everything in case anything moves before then, thus far I think that forecast is stable for the moment.

This doesn't mean we have a strong market, the fact there's a Hindenburg Omen shows how screwy market internals are.

From a Dominant Price/Volume perspective, there were only 2 averages dominant, the Dow with 21 and the SPX with 266, both were Close Up and Volume Down which is the most bearish of the 4 relationships and is often seen at points in which the market is nearing the end of a run and overbought.

Also supporting the near term overbought were 8 of 9 S&P sectors green today with Health Care leading at +2.21% and Materials lagging at -.16%.

Of the 238 Morningstar groups, a whopping 211 closed green so we are nearing the kind of internals that would be consistent with the market finding itself in some trouble soon.


After a quick look at Breadth Indicators, nothing is standing out beyond what I've already reported, but I think it is worth reiterating that of all NYSE stocks, only 45% are above their simple 40-day moving average and 47% above their 200-day moving average, more than half the market is below those 2 averages which is a breadth problem in itself.

I'm not making any case for a strong market here, I still think we are in stage 4 DECLINE and I think it resumes, we just have rotation and it's the SPY and QQQ's chance to do what they should have done with the IWM last week, that alone is a point that shouldn't be lost on anyone. The averages diverging to the degree they did today (which was so obvious it was forecast last week), is not a small thing.

This should give us some interesting opportunities as the entire idea since closing the QQQ/AAPL puts last Tuesday and the UVXY long Friday was to re-enter them at better prices and positions, that can be done with the IWM just about now and I suspect with the rest of the market within a day or so.

I'll check on futures as always and let you know if there's any funny business, but from what I see so far on a very short term basis (1-2 days), I think this is a normal market bounce like the IWM saw last week in the SPY and QQQ, other than that, it's FAR from normal.