Saturday, December 25, 2010

Friday, December 24, 2010

Happy Holidays Everyone, however....

The world is still turning and a very disturbing event out of China just took place as reported by the Wall Street Journal and ZH- A Failed Chinese Bond Auction?!?!


As a result, the Shanghi Composite Index is down 1.2%- VERY UGLY.

Thursday, December 23, 2010

More Trades

RDK is a grocer, you may remember my post which was bearish on grocers due to their razor thin margins and higher input costs.

RDK was one on the list. It's seen a bounce within a flag type pattern and ir looks as if that bounce is nearing completion.

 RDK 5 min showing slight accumulation for a bounce in white and distribution in red as it begins to round over.

 RDK 10 min confirming the chart above

And RDK 60 min which carries the most weight, very divergent. A stop can be placed either at $36.70 or to give it  bit more room, there's a gap resistance zone just above $37.00

By the way, XOMA just turned into a 200% trade in 4 days.

BAC and Financials

Yesterday afternoon under the post, Financials Update I showed you a few charts of the negative divergences and a rounding top. Today Financials are being hit. FAZ is doing pretty well, BAC is not. So far it's down about 3%. BAC may be offering a decent risk:reward trade. 

A short on BAC can be entered here with a stop above yesterday's highs at $13.45. With the way financials are looking, I'd say this is a bounce that is ending and BAC very well may continue the 7 month downtrend it had been in. I like the trade here, it makes sense as the risk is rather limited.

FAZ is another to take a look at, it's up +2.43% . Again, this is a fairly low risk, high probability trade with a stop below yesterday's lows around $9.40-about $.29 risk per share.

As you can see, BAC has erased yesterday's gains and is currently at a support level, if this support is broken, BAC could see a nasty move down.

Market Update

Support levels in the averages are being taken out. Earlier I posted a number of negative divergences across several timeframes, now we are seeing the market take out some important intraday support levels.

 DIA 3C negative divergence at today's highs-basically the highs were sold by institutional money.

 DIA support has been taken out around $115.60. Note the sell side volume at the intraday highs today. Also note MACD confirming the move down.

 The QQQQ showing negative divergences at the highs-again, distribution at the highs.

 Note the sell side volume at the negative divergence at yesterday's highs. The Q's have yet to take out the support around $54.65

 The SPY showing a negative divergence again at yesterday's highs. Right now 3C is in a nasty negative leading divergence.

The SPY has taken out today's intraday support as well as Tuesday's close.

More on Real Estate and REITS

Yesterday I wrote in this post, RESIDENTIAL UPDATE that it appeared the bounce is ending.Many of the REITS were already in downtrends.

Here are their charts today, most have reversed.

 CLP is at 0% for the day and will likely end the day lower

GGP is down on a reversal of the bounce today, -1.65%-MACD is also in a negative divergence.

SLG will most likely end the day lower

 SNH with a -1.54% reversal to the downside today, this is also in an established downtrend, MACD is confirming the downrend.

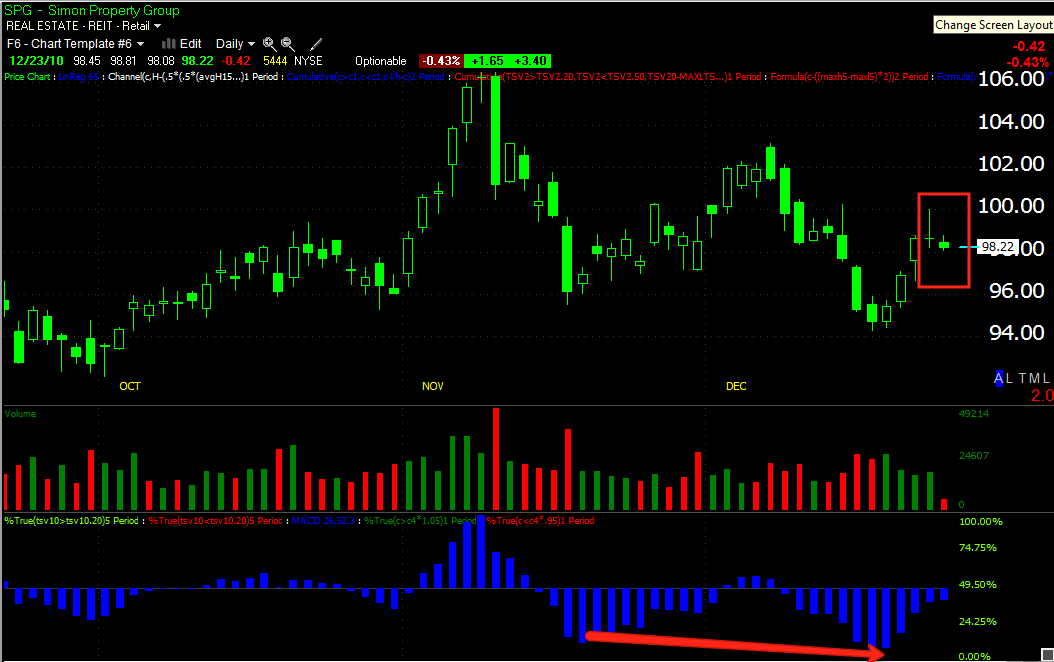
SPG-with a MACD negative divergence and reversal today.

These are REITS that are tied to various forms of Real Estate, residential and commercial. From what we've seen in the residential space and the last post on SRS, I'd say that this was no more then a typical bounce-nothing goes straight up or down and as pointed out last night, the sector is facing many fundamental problems.

If you like any of these ideas, they are fairly low risk/high probability trades. You can simply place a stop on a closing basis above yesterday's highs.

SRS UPDATE

BY NOW MY OPINION OF RESIDENTIAL REAL ESTATE SHOULD BE CLEAR.

This is a daily chart of SRS, note how close price is to support. A trade here has relatively little risk and the larger pattern of the descending wedge is a bullish one with a target of at least $25.

 SRS 5 min positive divergence

 SRS 10 min positive divergence


SRS 15 min positive divergence.

It looks like the pullback is SRS is over and it has successfully tested support and held. In my opinion, this is a low risk, high probability trade here and now. The target isn't too shabby either. Take a look and take this long trade under consideration. Remember, this is a leveraged, inverse ETF so buying SRS gives you short exposure to the Real Estate market.

Precious Metals Update

There's been a lot made of the JPM Silver market manipulation and the viral campaign to force JPM to cover their silver short. I really don't know about this, how true the rumors are, whether it's realistic to think people buying silver coins will force JPM to cover the short, but from what I've heard and more to the point, what I've seen, the $29-$30 level seems to be a line in the sand.

First the chart here does not look constructive, the long MACD I use shows a negative divergence and both attempts to break the $29 level have been met with some heavy volume.


The 3C 60 min. chart shows distribution at both attempts at $29

The 1 min chart today, thus far is in line, but until resistance is taken out, I just don't see the odds being very good for long positions in silver right now, at least not any substantial positions.


GLD
 The daily 3C chart above shows distribution at both attempts to break through resistance.


Above the daily chart also shows heavy volume on the breakout attempts

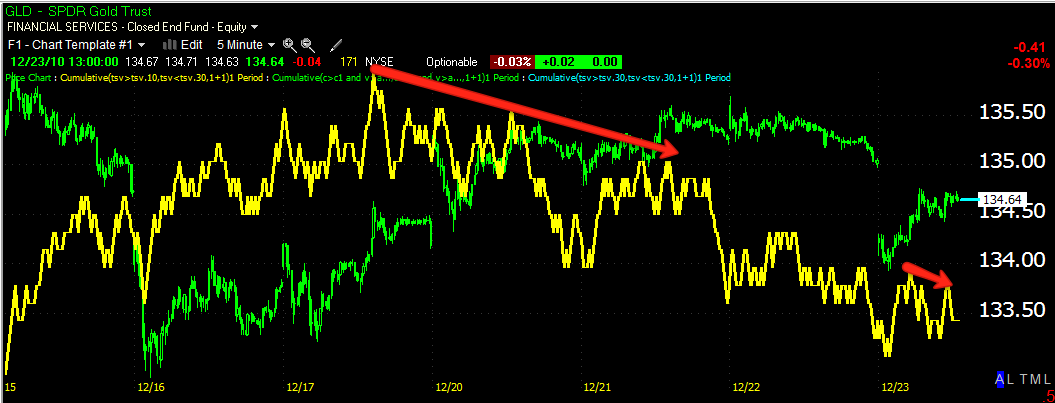
 The 5 min chart above shows distribution that led to a move down on a gap, so far the 5 min chart today isn't confirming the attempt to fill the gap.

The 15 min chart above shows that same distribution leading to the gap down.

Much like SLV, I just don't see either one of these trades (long) as high probability until the resistance levels can be taken out or until we see a healthy run of accumulation indicating that a successful attempt may be made.

As for short positions, other then the occasional quick trade of a day or two, I also am not seeing any outstanding advantages right now. Both SLV and GLD seem to be in a lateral trend and there's not much use in my opinion in having money at risk either direction without a pretty good reason.

Market Update

 DIA 1 min.

 QQQQ 10 min.

 QQQQ 60 min

SPY 5 min

Last night I mentioned the "Cats and Dogs rally" We are seeing some of those stocks pop and probably will see some more (XOMA, JSDA, etc), however, as you can see above we are seeing serious distribution in the averages in a multitude of timeframes. My experience has been the cats and dogs rally precedes a decline in the market. Right now we have evidence of both.

JSDA

JSDA has been featured several times recently, on Friday, December 17th I wrote the following,


"As you can see, JSDA has held the 200 m.a. for 4 months which makes for a fairly low risk entry."


JSDA since, has held that 200 day moving average.


Accumulation picked up yesterday and today.
 5 min 3C, showing strong accumulation yesterday and this morning.


The 10 min 3C shows the same.


So far it's up about 7% today. The volume is already double the 200 day average so it looks like it's going to be a strong contender moving forward.