Tuesday, March 1, 2011

LVS Trade Idea (Short)

 A big triangle-an obvious top that has broken down after kissing the pattern goodbye.

 30 min neg. divergences confirm the top/distribution/short selling.

 The 1 min suggests a bounce-a good place to initiate a short or phase into one.

ADX turned down from over 50-the end of the trend. The trend channel has held the uptrend perfectly here and the stop is just below $50, this looks to be a great trade, especially if we can get a bounce on it.

Follow Through or 1 day oversold?

Tomorrow should tell us a lot about how bad off this market is. the dominant price -volume relationship was price down and volume up which normally creates a 1-day oversold bounce, we also had some late day 3C positive divergences on 1 min charts. We should see a bounce correction tomorrow, but if we see resumed downside on volume, this market is in huge trouble.

If we get the bounce, it's still in trouble and you just need to keep your eye on the trend, it would be very normal to see a bounce tomorrow and healthy for a bear market as well. If we don't-watch out below.

Another Warning-

Don't get lost in the lines of intraday pullbacks, maybe an oversold correction tomorrow or any of that, remember the bigger picture, that' what you should be preparing for. Here's a reminder.


The market has done what we've expected since that wedge and is looking very bad. I'd try not to get too aggressive in trading the jiggles and keep your eye on the prize.

Naval Assets

The USS Kearsarge and the USS Ponce as well as the Enterprise Aircraft Carrier are all en route-thse are strike groups so there are additional ships within each. Like I said when Egypt's Mubarak left, "this isn't the end of anything, it's the start" and this is a very ugly region with massive implications. I doubt the Fed can fight the market too long on this one.


Story from the National Journal

The US is escalating uncertainty with the Troop/Naval/Air force Deployments

And the market hates uncertainty, especially just before a potential outbreak of hostilities. Thus the term, "when the missiles fly, it's time to by". Because we love war? The market loves war? I don't know about that, I do know that it has a lot to do with the fact that the uncertainty has been removed.

check the news for the latest deployments, Stratfor should be updating US Naval positions, but the  Kearsarge with it's marines and amphibious assault craft as well as jump jets is moving on scene. Germany has sent several attack ships as well as Canada now. Check Google for Robert Gates + Libya + Troop deployments. There are other naval assets in the region as well, I believe we have an aircraft carrier or two -I'll have to check Stratfor's latest deployment map.

F Trade Alert

I just mentioned this one and it has given a swing short signal at $14.89 (remember yesterday's risk management example) -stops include: $15.29 and what is now $15.69.

INSIDERS STILL WANT OUT

Update-I corrected the $ figures, forgot to add the zeros.

Bloomberg released the insider sales to buys report today, here's the chart of what they look like


That ratio is 122 shares sold for every 1 bought, it's been like this for a long time. In dollar terms, about $128  million in buys and and $5.4 Billion in sales. As always, there's a lot of reasons an insider may sell, but "I think my stock is going to be worth a lot more soon" is not one of them.

Another Clue

As price didn't already tell us this market is ugly, thus i've been encouraging you to raise cash, lower long margin and get your toes wet on the short side, we also have this NYSE TICK chart and this is the worst I've seen it since watching it.

This shows advancing issues and declining issues for each tick on a 1 minute chart. It's rare to see a couple of spikes at -1250, today we see most of the day there. This is part and parcel of the horrible market breadth I've warned about as the Fed manipulates the averages higher, but not the entire breadth of the market-it's called "Getting the most bang for your buck" to create the "wealth effect" and it's done by buying the heavily weighted stocks on an index.

THIS CHART IS REALLY UGLY

SPY

For our newer members if I didn't say it, obvious pattern like this wedge get broken up before they take off, there's still a positive divergence there so we still have a very good chance of seeing an intraday move to retrace the wedge, whether that is today, or tomorrow morning, I don't know. However, anytime there's an obvious technical pattern, the black box trading algorithms that search them out, usually throw traders off by initially doing the opposite of what is expected (in this case an upside breakout), after they run the stops and limits, they usually turn the pattern to what it should do, so we can't automatically assume this is a failed pattern, in fact, we usually assume that this is the black box game and the pattern is still relevant.

MOVEMENT IN THE DOLLAR/EURO

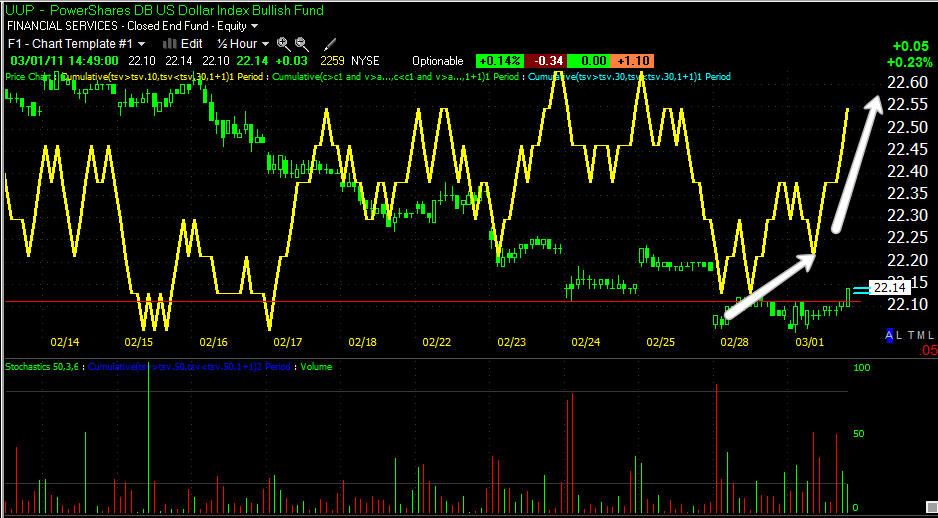
UUP is our dollar index proxy as the DI doesn't give me intraday volume information.

FXE-Euro Trust ETF
 60 min negative divergence-leading too!

 15 min leading negative divergence

 And th recent 5 min activity, Euro falling!

 FXE daily chart-hit resistance today and looks to be a failure of momentum opening the door to downside.

UUP-the Dollar index is weighted 50% by the Euro, so the Euro has the most effect on it and UUP

 UUP crossing resistance just recently on the daily chart

 30 min positive divergence-another downside head fake?

15 min positive divergence-usually the timeframe where we see reversals.

I'm not sure what the catalyst is here, but we do have some bullish movement in the dollar. Traditionally, the dollar has an inverse correlation with commodities, equities and especially oil.