Around 2:30 today the market started to discount the newest rumor regarding Greece, that the country had spent even more then previously thought and now the Troika would have to alter the terms of the second July 22nd Greek bailout and banks holding Greek debt were likely to take an even bigger haircut. Estimates on bank losses range from a conservative 30% to a more likely 60%, which will put the French banking industry in chaos as the reality of just how undercapitalized is sinking in more each day. This is contagion spreading to the core, the eventual reality for France and next Germany as resentment between all the Euro players from Greece and the rest of the PIIGS to the core countries who are taking on the responsibility of trying to keep a sunken ship afloat, in total vain.

I'm not sure when this rumor was known in the market, but this upside breakout in the trading range was an obvious trap as distribution was present long before the breakout took place. Traders often watch trading ranges and go long or short on the first breakout of the range. The downside volume on the bottom end of the range shows the extent of the losses being taken by longs who bought the intraday breakout, which we were selling in to today.
DIA 1 min shows the distribution in to the breakout and some late day accumulation which is the start of what I was hoping to see when I took profits earlier n the day on the chance I may be able to add those shares back at a lower cost basis to later take profits on them again.
DIA 2 min & 3C depth chart shows the accumulation that started this move up as well as today's distribution.
DIA 5 min shows today's distribution clearly, which was evident in the flat trading range, distribution picked up in to the move higher out of the trading range as Wall Street used the opportunity to sell in to demand and higher prices.
DIA 15 min chart is still in a very strong leading positive divergence as this round of accumulation seems to have been the heaviest round in the last 7 weeks, some distribution today is also evident to a lesser extent.
DIA 30 min shows past distribution in to rally highs and the current leading positive divergence.
DIA 60 minute also shows some longer term accumulation and a leading positive divergence.
IWM 1 min shows th same as the DIA with some late day accumulation starting.
The 2 min chart is not much different with distribution today and also showing the accumulation zone for this current move up. There are approximately 3 days of accumulation, if the 7 week ratio holds, we should see 3-5 days of rally with 1.5 days already in place.
The 5 min negative divergence today, note the distribution in to the range upside breakout.
IWM 10 min leading positive divergence as well as the accumulation zone and some slight distribution on this chart today.
IWM 15 min showing history of past rallies and declines as well as the extent of the current positive leading divergence.
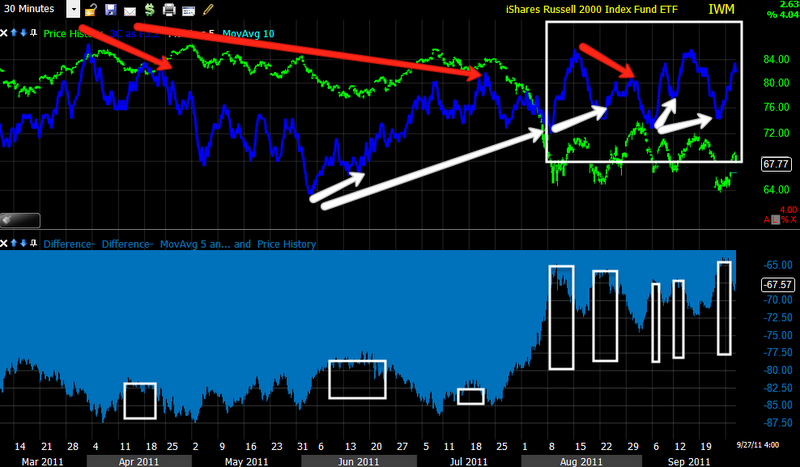
IWM 30 minutes with history since the March-July top, accumulation zones of the past 7 weeks and the current positive divergence on a larger scale including most of the past 7 weeks which makes me think we may see a decent rally up, it may not be this round, but it appears one will come with some serious upside.
QQQ 1 min hart showing the same distribution today as well as the 1 min accumulation in the late afternoon.
QQQ 5 min w/ distribution of the last rally, the current accumulation for this rally and selling today.
QQQ 5 min chart with some history and showing a negative divergence today, even within a leading positive divergence.
QQQ 10 min showing accumulation , a leading positive divergence and some distribution today.
QQQ 15 min leading positive divergence, trade is pretty much in line on this chart.
SPY 1 min and this afternoon's distribution in to the upside head fake at the yellow arrow. This chart does not show the late day accumulation the others show.
SPY 5 min chart of accumulation, confirmation, distribution today and the head fake move in yellow.
Distribution on the 10 min chart shows today's distribution was heavy.
The 15 min chart shows the same.
However we always see and expect to see the accumulated shares under distribution in to higher prices/demand, this is not unusual for a rally.
There's still a possibility we see a scenario like this with initial accumulation, a rally followed by more accumulation and a larger move up. We'll have to see whether accumulation picks up enough to send the market higher or whether distribution continues in to the pullback.
This is the Euro after the close today.
This is the Euro during market hours today. The market trades roughly in line with the Euro.
FXE Euro ETF 1 min chart with afternoon accumulation sending the market through the trading range, with distribution at the trading range breakout and some late day accumulation like many of the averages.
FXE 5 min, accumulation and a leading positive divergence.
FXE 15 min, the larger trend in the Euro seems to still show a leading positive divergence hinting at more Euro upside and market as well.
FCx a coal stock often leads the market. Today the 1 min chart looked much like the rest of the market with dist. and some late day acc.
The 5 min chart also confirms what we are seeing in the rest of the market
The 10 min shows the same depth of distribution seen in the SPY
While the 15 min chart still remains pretty positive, usually we don't see an end to the rally until this 15 min chart goes negative.
The FX 30 min chart is very positive looking, suggesting we may see a bigger move then the 7 week correlation suggests
The 60 min chart shows the same.
TLT 20+ year treasuries 1 min show strength as the market was breaking out in today upside head fake, also some late day distribution as TLT trades largely inversely to the market as a safe haven trade.
TLT 5 min showing some weakness today toward the end of day
TLT 15 min shows accumulation before the FOMC announcement targeting the long bond, obvious inside information being trade on a "FAD" leak and some accumulation today as the market was under distribution.
TLT 30 min, longer term there seems to be some weakness in the longer term outlook for TLT, suggesting the knee jerk reaction to buy the long bond may be reversed.
The TLT 60 min chart shows the same. This would tend to corroborate the idea of the market making a larger move up sometime in the not too distant future.
VXX-volatility which trades inversely to the market. VXX 1 min showed acumulation today while the market was showing distribution, however the move up in VXX was not seen inversely in the extent of the move down in afternoon market trade, which is a little surprising.
VXX 5 MIN was also very strong today.
As was the 10 min hart, this would tend to suggest early downside for the market tomorrow.
The longer term 15 min chart is in a leading negative divergence while most of the market is in a leading positive divergence.
The same is true of the longer trend on the 60 min chart.
I would guess that we see some early weakness tomorrow, perhaps in to the afternoon, if so, I'll be watching for short term positive divergences in which case will add back the shares I took a profit on today and those of you who may have missed the chance to go long this move may get a second chance to buy. It is perfectly normal for the market to pullback within an uptrend. Over the course of the last 7 weeks we have seen 4 rallies with this being the 5th. n at least 3 of those rallies we saw intraday and 1 day pullbacks as strong as today's or stronger.