Friday, June 8, 2012

USO Update

 USO 2 min with a leading positive, the negative on the highs yesterday was quite strong

 3 min leading positive, again yesterday's highs was a strong divergence

 5 min is leading, yesterday's highs also strong here

 5 min close up of the leading positive

 The 10 min is starting to lead positive

The 15 min hasn't seen that strength bleed through yet and is inline.

Maybe USO is going for a gap fill, maybe more. I personally am not interested in a new position here, if you are I think you need to be nimble and consider the Chinese data dump tomorrow.

If the 15 min chart goes positive then I might reconsider. If you do try this long, I'd strongly rec'd it be a speculative trade with a trailing stop, but not too tight

Market Update cont...

Again, thus far 3C trade looks much better today than yesterday

 DIA 1 min leading early on with a negative divergence, this seems to me to be ca consolidation or a battle as there are several resistance areas that technical traders would view as a shorting opportunity.

 2 min again leading early on, went slightly negative to bring the DIA in line.

 3 min leading positive above much of yesterday's highs, a slight negative which can lead to either a consolidation or pullback on these timeframes, currently about in line.

 The 5 min suggests that this is a consolidation as it is leading positive above all of yesterday

 IWM 2 min was very positive on the open and leading above all of yesterday, it went slightly negative in the flat consolidation area (consolidation at least thus far).

 IWM 3 min positive on the open, leading positive above all of yesterday with the same slight negative divergence in the consolidation area.

 IWM 5 min is leading positive, no negatives, and above most of yesterday, this leads me to believe we are at a resistance point/consolidation

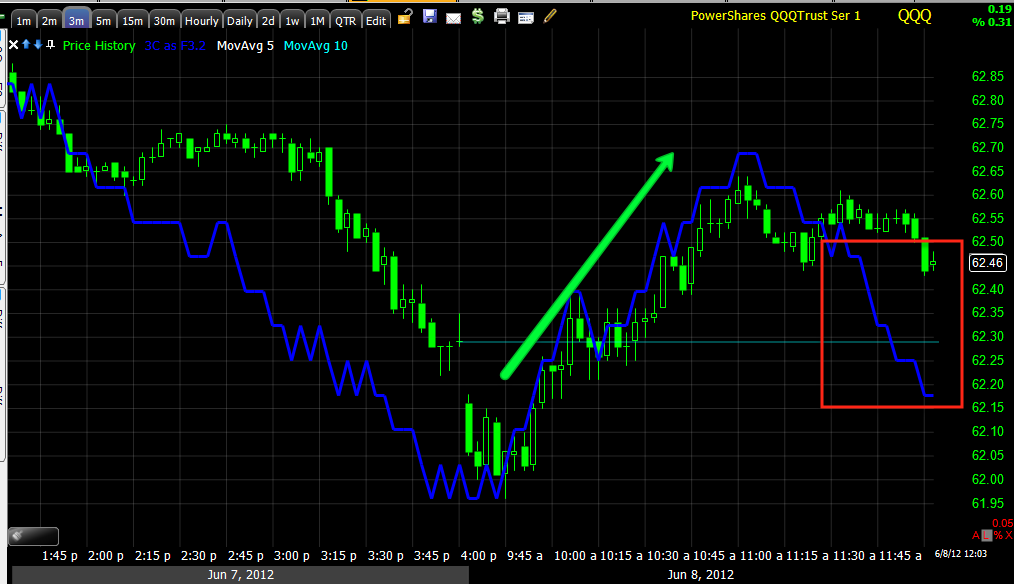
 QQQ 1 min leading positive earlier, went negative and thus far has been consolidating sideways through time.

 QQQ 2 min with a strong positive divergence on the open, a leading positive above all of yesterday and the negative seen in every other average

 QQQ 3 min in line with a slight leading negative at the consolidation area.

QQQ 5 min leading positive, no signs of a negative divergence, above most of yesterday's trade.

 Traders often watch the 50bar 5 min moving average, you can see it act as support and resistance, this is why I think shorts are lining up here at resistance leading to the consolidation. The 5 min charts seem to indicate this will resolve to the upside, but its still early on those charts.

There's also resistance in the form of yesterday's support, once broken it becomes resistance. I think there's a little battle going on here between shorts and...

Full SPY Market Update

I'll post intraday updates for the other averages next, thus far today's trade is a lot better than yesterday's, coincidence? Remember the chart I posted before we even got moving of where to expect games and the specific area hit yesterday as being one of them to make traders think the test of resistance failed. I'm not saying the games are over, I'm saying the SPY 3C trade looks a lot better today than yesterday thus far and it gives me more confidence in my gut feeling that the invisible hand WAS at work late yesterday pushing the market lower to create the impression of a failed test of resistance.


 1 min chart was slightly leading, it saw a small negative divergence that put 3C in line with price.

 The 2 min chart since June 5th shows some of the underlying weakness in 3C short intraday timeframes I mentioned last night, but...

 Intraday the 2 min is leading positive with a slight negative in this area.

 The 3 min was perfectly in line with price and then reached further to a leading positive, the negative divergence on the 1/2 min charts must not be that strong (at least as of now) as it doesn't show up at all here.

 A little longer view of the 5 min, you can see 3C's relative weakness, especially at yesterday's close, but...

 Again this a.m. the 5 min chart was perfectly in line with trade and is now leading positive, there's no negative divergence, just trend confirmation as price is lateral right now.

And the 30 min chart just for the broader perspective.

The other averages are coming next.

Overnight and in to the open

I'm a bit late this a.m., I was working on posts and answering emails until about 2:30 a.m. last night, but I've just been looking around at opening trade and especially FB which is now breaking out over 4%, I have several emails this a.m. of members who got in yesterday after the update, the retail traders on Twitter are still shorting FB which is classic and I love it, it will only make the move that much bigger. I'm no FB fan, but you take opportunities where you find them, the days of liking a stock for its business model are gone, the market no longer has anything to do with value, just perception and easy money game like ripping FB higher on intense bearishness. Heck, when the time comes I may even short FB, but for now, I'm letting the Calls ride.

Overnight...

Asia didn't do well last night, first the market was happy with the PBoC Chinese rate cut, but news articles have circulated speculating that the cut was done in advance of a batch of Chinese economic data due out this weekend and the fear that it will be much worse than expected. Oil has traded down on Chinese economic data fears, a slew of reports are due Saturday.

Well this is more early this a.m., you may recall my brief overview of the very mercurial nature of the Spanish position on whether they want, did or did not or did and then recanted, ask for bailout assistance. Can we finally put this to bed?


From Reuters:


Reuters reports: "Spain is expected to request European aid for its ailing banks at the weekend to forestall worsening market turmoil, becoming the fourth and biggest country to seek assistance since the euro zone's debt crisis began, EU and German sources said. Four senior EU officials said finance ministers of the 17-nation single currency area would hold a conference call on Saturday to discuss a Spanish request for an aid package, although no figure had yet been set. The Eurogroup would issue a statement after the meeting, they said. "The announcement is expected for Saturday afternoon," one of the EU officials said." 

Now the ONLY little problem is that the EFSF/ESM don't have the money to bailout Spain, which may not seem like huge news given we were slow boiled with this news, but if you recall only 6 months ago, a Spanish bailout was considered Armageddon for the EU, the one country that is too big to save and thus the final domino in the PIIGS chain of dominoes that leads to an EU collapse. With the ECB sitting on the sidelines, it will be up to Germany to more or less fund whatever it can, right about the time when German voters are ready to through Merkel's CDU party out of office for burdening Germany with huge contingent liabilities, this should be a barn burner and it's no wonder the rating agencies are so quick to downgrade Spain so they can retain some credibility, it should have happened six months ago.

Unfortunately it doesn't look like this schizophrenic episode is any way near being put to bed. Germany responded very quickly...


"The German government on Friday reaffirmed that the European bailout funds were ready to support Spain, if Madrid applies for aid and accepts the conditions tied to it. “The decision is up to Spain. If it makes it, then the European instruments for it are ready,” government spokesman Steffen Seibert said at a regular press conference here. “Then everything will run under the usual procedure: a state makes a request, it will be liable and it accepts the conditions tied to it.” Seibert declined to comment on rumours of a possible Eurogroup teleconference this weekend to consider an aid request from Spain that might be forthcoming."

In bold is the kicker, "the conditions" which seem to be why Spain asked, then denied, asked again and then said it didn't, apparently the "conditions", which typically mean kicking out the Prime Minister and Finance Minister and replacing them with Goldman Sachs alumni, demanding harsh austerity that sends an already ailing economy in to a worse depression and sends unemployment through the ceiling (at this point we're talking about the second story ceiling as Spain's unemployment is already off the charts). Then there's the EU financial overlord who has the right to veto a sovereign country's financial and budget decisions. As for all of those European perks like 6 weeks of paid vacation, comfy government jobs, healthcare and pensions, say bye bye. Oh and while they're at it, Germany will probably request a quit-claim deed for the island of Ibiza, which will shortly become a German speaking playground.

That sounds like a lot of hyperbole, but every one of those examples has happened or been proposed in previous bailouts. 

Oh and the framework being in place also is another not so subtle hint that Germany won't be backing Euro-bonds and if Spain wants money, they better stop backing them as well.

After Germany's response, it wouldn't be surprising for the entire "we asked, we didn't ask" saga to continue,  well true to form...

Officials in Spain deny any knowledge of a weekend meeting over the Spanish banking sector bailout!

So they did or didn't ask? Chances are they did ask, they didn't like the "Conditions" Germany talked about and now are denying knowledge of a meeting, but haven't addressed whether they did or did not ask. I'm sure they did. Why don't they do these things through telephone calls before humiliating themselves in the press?


Is it me or is Europe just completely whacky, incompetent, indecisive, etc., etc., etc.? Also don't be surprised to see a Moody's downgrade of Spain as they are the last of the rating agencies that as of yet have not cut Spain.


After the open GS cut their Q2 GDP estimate...


We revised down our Q2 GDP tracking estimate by two tenths to +1.8% (quarter-over-quarter, annualized) from +2.0% previously. The downward revision primarily reflects weaker-than-expected real export growth in April. This was partly offset by stronger than expected wholesale inventories, which increased by 0.6% (month-over-month) in April

Finally I'm a bit surprised at the market open ES lost about 10 points overnight yet the market opened near unchanged?  In fact ES is now 6 points lower than yesterday's close, but the SPX is in the green, not sure what to make of that.

Updates coming-Go FB! +4.5%


Here Comes FB

First we saw the bearish descending triangle and in classic position, bears would be salivating all over themselves, then the head fake, yesterday I identified what I thought was an inverse H&S base, today it is just breaking above, so far at +3.46%

I hope some of you caught this one, I think it's going to produce a nice move.

Recap of events...

The main theme today was certainly Bernie's testimony on the Hill. What is the F_E_D up to? Overnight the F_E_d's #2 strongly suggested QE was coming, other F_E_D speakers this week have all but come right out and say the same. The Chinese cut rates and the market started dreaming of the global Central Bank intervention of November 2011, Bernie's testimony on Capital Hill seemed like the perfect time to hint at QE 3, yet it didn't come. Why would Yellen be out there hours before Bernie testified saying nearly the exact opposite of Bernie? Is it realistic to think that the number 2 at the F_E_D doesn't have a clue as to what the chairman is thinking or more likely was this some sort of subterfuge?

The market didn't like Bernie's prepared remarks, but it was willing to wait out the Q&A to see if he might slip up and hint at QE, he didn't.
The initial reaction to the prepared statement and a holding pattern during the Q&A, the market didn't seem to be inclined to leak much lower, it seems 3 p.m. the panic button was hit and the invisible hand got to work.

This is the area I warned about yesterday as far as volatility and some game plating in an attempt to anchor expectations.

Although Gold, one of the biggest beneficiaries of QE, had a horrible day, it was curios during the afternoon. The initial disappointment with the prepared remarks is seen at the first red box, then a holding pattern during the Q&A session in yellow, once it was clear that the Q&A didn't yield any hints of upcoming QE, gold sold off again, but it was then content to spend the rest of the afternoon in a range. As mentioned several times, it seemed like the market was also content to sit in a range, 3 p.m. that changed and I suspect it was intentional.

Around 10 a.m. Fitch warned about a possible US sovereign downgrade, the market didn't seem to take much notice.

Around noon time Fitch cut Spain's credit rating not by 1, not by 2 but 3 notches to BBB (junk) on the banking sector problems-it seems no one is buying any EU rescue plan and for good reason; they have no credibility. This is the 3rd Spanish credit rating downgrade, Egan Jones, S&P and now Fitch. Again the market seemed unmoved, even the Euro didn't over-react, in fact after the downgrade from A to BBB "outlook negative", the Euro did manage one more intraday bounce.

As we saw last week, the cost of a Spanish banking bailout is rising exponentially, the current estimate is between $80 nd $100 bn Euros, if memory serves me correct, it was $19 bn then 20 something, then $40 something, now as high as $100 bn and I'm sure we are not done.

Merkel (as Germany is the only provider of funds now as the ECB has gone radio silent) said she was willing to use existing bailout mechanisms to help Spain, it remains utterly unclear whether Spain has asked for help or not. There were newspaper reports saying Germany and France were pressuring Spain to seek assistance, followed by a denial from officials in Spain, followed by a plea for help from Spain and now it seems no one knows where Spain stands. It is clear where Merkel stands though, I'm not sure what was bigger news, that Merkel was willing to help Spain via EXISTING instruments or the fact that "existing" ruled out Euro-Bonds which should again ignite the North vs South divide as France aligns with the PIIGS with regard to Euro-Bonds while Germany clearly (Merkel' statement was the latest confirmation) DOES NOT support the idea.

At 3 p.m. Consumer Credit missed and missed big
Released On 6/7/2012 3:00:00 PM For Apr, 2012
PriorConsensusConsensus RangeActual
Consumer Credit - M/M change$21.4 B$12.0 B$7.5 B to $18.9 B$6.5 B

 CC came is at nearly half of consensus and about a 69% decline from the previous, this was a huge miss and more or less is timed with the market sell-off, however it just seems very strange that there were much bigger disappointments in the market today that didn't have the same effect.

A quick look at the SPY intraday seems to suggest something a bit different.

It seems the 12pm - 1pm move higher first alarmed the market (and you know who I mean, it seems they were not wanting to see the market move higher and that's where the first significant divergence (other than the open) occurred. Consumer Credit may have been used to further the cause, but it seems concern was starting earlier as the market started to trend higher.

3C trade in the intraday timeframes of 1-5 minutes was generally uglier than the close would suggest (mixed between down about .30% to up at .44% and the SPX nearly flat).

I'd expect weakness in to tomorrow's open, which will give us a chance to see what the underlying trade looks like.

Thus far Asia is continuing the US session in a risk off mode, the S&P futures are off 14 points as of now. The Euro is holding right around the uptrend line for now.

Tomorrow there isn't much in the way of tier 1 data so on the economic front it should be a bit quieter and compared to the Bernie Road Show, quite  a bit quieter on the news flow front.

That's about it for today, although I feel 3C trade was uglier than I'd expect, when in doubt, look at the bigger picture. As of Wednesday's post I tried to anchor expectations and let you know in advance this would be an area to expect volatility so I feel we're on track with the market trend (meaning behavior).  Although specifics prove hard to predict, the macro events such as the break below the pennant and rebound back above to the volatility at the test of Euro and market resistance at the level predicted, I think thus far we have been pretty much ahead of the game in that respect. There are two big pictures to keep in mind, that which is on the 30-60 min charts and that which is on the daily charts.


Thursday, June 7, 2012

The Averages...

 DIA 1 min, the DIA has been a 3C laggard, today it looked a bit better than other averages (relatively speaking). The 1 min trend has gone from positive to confirmation, today there's a leading negative, again suggesting more near term downside.

 A closer view, like everything else, the DIA was negative on the open, saw some intraday positive and negatives that weren't too impressive, but the end of day action is the most impressive divergence in a leading negative position. I'm speculating, but it seemed the averages weren't going to move low enough on their on and got a helping hand for reasons I've outlined.

 Again, even as a laggard, the 30 min chart is the largest divergence since the May 1 negative at the top, the yellow arrow is the false breakout of the bear pennant, a Crazy Ivan shakeout to the upside followed by a shakeout to the downside, the leading positive position just seems too big, too intentional for a 2 day upside move from the point in which the SPX made its low breaking the 200 day moving average (another closely watched indicator). Again like so many other asset classes the positive divergence starting on the 7th and running here until the 10th (other assets saw it run until the 15th and a few beyond) is curious.

 Keeping things in perspective, the primary daily (2-day here) chart of the DIA shows a leading negative divergence that is now at the same area as the 2009 lows. The negative divergence culminating in late July of 2011 that led the market down 20% is also clearly visible. If you look at 3C since the October lows/rally, you can see why I've been suspicious of the entire rally.

 QQQ 1 min like everything else from industry groups to currencies was negative on the opening gap up. The EOD saw the largest divergence of the day, leading negative, which is why I suspect the invisible hand was at work in the market as it seemed like it was going to close higher with an ambiguous star like close, I suspect there was a late day effort to push the market lower. Again, this is why I posted that article yesterday regarding what to expect at certain levels such as the area we reached this morning, what I called "games" in the market at those particular price levels.

 QQQ 15 min negative on the open and a leading negative divergence got the market moving lower EOD. The longer term trend of the 15 min QQQ chart has been in leading positive position since May 7th.

 Even the hourly chart has been moved to a positive divergence in the Q's, a divergence this size seems very out of place for a 2 day move up. The positive divergence on the 7th is visible on this chart and the strong relative divergence at the recent lows is larger than the May 1st top. As you can see the 60 min chart is leading positive. Just look at the overall 3C/price trend, a clear change in character is obvious.

 For perspective, the daily QQQ chart with a very fast and sharp negative divergence at the top with a deep leading negative divergence, this is the primary trend, the reason why I have kept the core short positions and the reason why I view longs as worthwhile, but speculative. This chart suggests the next primary leg down will be quite large as this is the strongest divergence in the QQQ , even worse than the 2000 tech bubble. Without going in to a new post, the reasons for this very strong divergence have their roots in F_E_D manipulation of the market via QE/POMO. There was no true organic strength in the market, this is clear when overlaying the QE1/QE2 periods on the price chart, when there was no QE the market started falling apart. Thus the only reason the market has moved higher since 2009 has been policy intervention consisting of flooding the economy and banks with liquidity that found its way in to the market. When you have money at .75% interest, of course you are going to put it to work in higher yielding assets. I believe QE 1 & 2 served 3 purposes, they allowed Congress to keep spending, they made it possible for the US to keep issuing debt in a debt market that was otherwise getting soft (as China slowed their purchases of US debt to a trickle), they made it possible for the US to pay debt obligations at a much cheaper price as the dollar was devalued (yes your bonds were payed, but with dollars so devalued that you actually lost money) and finally it allowed banks that were near the verge of collapse to post impressive profits rather than the F_E_D having to bail them out. From today's Bernie testimony though it seems clear that he is sending Congress the message that they can't keep doing this, that ultimately the problem must be resolved on Capital Hill by cutting spending.


 SPY 5 min -positive at the recent bottom with a negative divergence on the open and a leading negative moving throughout the afternoon.

 SPY 30 min going back to March. The March top, a bounce in to the Mat top and again that positive on May 7th the SPY stayed in a leading position through the bear pennant and went even more positive at the breakdown lows to form a current leading positive divergence above the May top.  No matter how ugly charts were today, it didn't move the 30 min and the size of the divergence is just too big to think 2 days of upside is what this was all about.

SPY daily chart for the primary trend perspective. No matter what lies ahead, even if we saw a rally to new price highs, there's just too much damage for this market to escape its fate short of massive intervention and even that may not have the same effect as before, too much has changed.


Currencies...

 EUR/USD from Sunday night's open of the FX market, the Euro with all time highs in short interest  just tested major resistance. One of two things were going to happen, a blast through resistance and a strong short squeeze or a failed test, which as I posted regarding the market yesterday, I leaned toward an initial "seeming" failure of the test which would embolden shorts- this is one of the classic short set ups, a break of support, a test of what becomes resistance and a failure of the test. This creates a low risk entry for shorts as their stop would be above resistance so you can see how it would draw more shorts in to the market. If the Euro breaks above resistance, all of the new shorts will have stops just above which will trigger a wave of buy to cover orders-increasing demand, which drives prices up and causes the more hardcore shorts to start encountering losses or covering to try to preserve profits, which leads to more upside. As I have explained many times, the entire concept of head fake moves like this are to create a snowball effect in momentum and it's the reason so many reversals start with a head fake move. The head fake move has allowed us to enter most of our positions at the best prices with the least risk, even though entering the position during the head fake move at the time seems counter-intuitive or risky, it is actually the least risky entry with the highest probabilities. Very often the correct move in the market is the move that our emotions are fighting against.

 The EUR/USD from regular hours open to close, that's 3 attempted tests with each weaker than the previous, from a short's perspective this is encouraging.


 The current market in the pair as of about 9:40 p.m.

However, since Friday, the up trend line remains intact, higher highs, higher lows. I'm sure I'm not the only one looking at this trendline, therefore I'd expect it to be broken to the downside, Wall Street knows what traders are watching and they have the proof in limit orders on the books. Even as a small trader I believe you should never put your orders on the books for professionals to see. The one time I used a stop on the books (on vacation), my stop in a long position was hit, it was also the low of the day and the stock took off from there. Pro traders have enough advantages, why freely give them more? Wouldn't you like to know exactly where smart money's entries and stops are?

 Euro 15 min chart has been mostly in line since trending higher, there was one negative divergence and a pullback the next day, today formed another negative divergence and even the gap up opening was a form of a head fake move, they clearly had the intention of selling in to the gap up, it's highly probable that orders on the books told them where the orders were and they used that information to their advantage. There was a mid-day positive sending the Euro higher, it ended approximately in line with price.

 As the short term charts are cloudy I often will return to the bigger picture to keep my bearings, The May 1 30 min negative divergence was quite strong and the following downtrend impressive, however we are now in a leading positive position with much of that momentum coming at the recent lows. As mentioned earlier, I find it hard to believe such a large divergence on a 30 min chart would be needed to create 5 days of upside in the Euro, the same could have been done in a few days on a 15 min. chart.

 The 5 min Euro negative on the open and negative at the 1:30 test of resistance, yet comparing relative points (green) shows the Euro is in line intraday (confirmation) rather than a worse negative position. Comparing the white relative points, the Euro was actually stronger at the 3 p.m. bounce than the 1:30 test, even though prices were lower. It just doesn't look like the type of distribution seen at a true selling event, it looks more contrived.


 $USD 1 min was leading positive at the gap down open, it went to a negative divergence at the intraday highs, the second positive divergence at 1:30 was much weaker than the opening divergence (compare at the two relative points marked in yellow). Also the intraday negative divergence around the 11:30 area saw a much higher 3C position than the ending position of 3C which saw prices nearly the same.

The $UD 15 min chart shows activity at May 15th, this is when I first noticed something was going on with the currencies, the 7th is an interesting date in equities, the 15th in currencies. The 15th saw a leading negative divergence in the USD and a leading positive in the Euro. Since the $USD topped around the 31st of May with a negative divergence and remain pretty much in line or trend confirmation. The bottom line is on the more important charts, there doesn't seem to be anything indicating the Euro won't move higher and the dollar lower which is market positive. On daily charts, the Euro is very negative and dollar still very positive, in line with the primary trend in stocks.