The momentum is just too swift, the gain too nice. I think we can probably re-enter at lower cost in a bit, but I'm leaving at least half the position open.
That's Bernie's response, I guess when you have a limo driver and never pump your own gas or go food shopping and don't run a manufacturing company that just saw its guts squeezed out do to commodity inflation eating through margins during QE2, then I guess you can say that and the graphic will support it because we don't count the "Volatile food and gas" in official inflation and considering the deflation of the housing market and any spending that was associated with that, then yes, pat yourself on the shoulder Bernie, you've done a wonderful job of creating a bubble based on nothing more than paper and ink, but the unemployment rate hasn't budged :)
A Senator just asked Bernie about his policies hurting and degrading those who did the right thing, those who saved money which is now worth much less... Oh, call the man out on the rug, but of course we have the wealth effect of the Stock Market for all those unemployed's 401ks...
This is a perfect example of a long position that isn't quite a Cat & Dog trade, but is a "Sale" stock compared to AMZN, GOOG, AAPL or any of the other names dumb money would be interested in, they feel like more shares = more gains, this of course is not true. One share of GOOG can gain just as much as 200 shares of ZNGA, but this is what we see when dumb money enters the market and this could be seen clearly lat night in the Worden T2 indicators, "Percentage of stocks above 40 day moving average" or the 1 or 2 standard deviation above the same average, the momentum stocks. Dumb money is always pulled toward that age old human tradition of looking for a sale or bargain, which doesn't mean ZNGA is one, it means the share price is cheap and as already addressed, the misconceptions about the number of shares one owns.
That being said, we had a beautiful trade in ZNGA as I believe it is in a longer term base and starting to pull out of it, we took a lot off the table because of the pullback expected, but held some to see if we can get some more upside from the stock. I still think ZNGA can pop more, but market pressures are always going to have the greatest gravitational force on any particular stock on any particular day, just look at the number of losers in the Dow yesterday, my scan pulled up 27 of 30 losers. If the biggest stocks like the Dow components can't avoid the gravitational pull of the market, which ones can? I'm going to bold this section because it is a concept that you should know, why?
People go about looking for trades the wrong way, they start with the stock and the market is just a curiosity. You START with market analysis, then figure out which sectors are best aligned with the market view and then look for trades in those sectors.
The most powerful force on any given stock is first the market, second the Industry group and lastly, the stock itself. There are of course caveats to any rule, but that's the rule of thumb.
Back to ZNGA...
ZNGA has a nice gain with ZERO leverage, the position is smaller than a speculative size so this position at this size is no serious risk, therefore I'm inclined to give it some more room. Would I add here? I would not at this point, but I'd hope to at some point when it is in a better place.
Here's the base for ZNGA, the yellow arrow is stop hunting move which allows Wall St. to accumulate the stopped out shares. The recent surge in volume looks a lot like a stock getting ready to move to a stage 2 "Mark up" trend.
The Trend Channel is still holding the trade, there has been no stop out since the year started, the current stop is just below $3.00, you never want a stop at a whole number like this and I prefer to keep the stop mental and ALWAYS on the close.
The 3 min chart shows the accumulation at the pullback as we were hoping for, yesterday put a halt to momentum as you'd expect.
The 10 min chart is also positive
As is the 15 min chart. At this point I think there's enough accumulation in the stock that they have to move it higher.
With a long term 4 hour chart, the base and positive divergence is clear, this area looks as I thought initially, a consolidation.
I personally would not want a lot of exposure to this position because it needs a wide stop here, but for a reasonably sized position with decent risk management and especially if you have some room with a gain, I personally would like to try to hold it for a while longer.
I try to give you tools and examples when they are there, hopefully you find some use in them and put them in your own tool box.
Yesterday morning I said, if anything, I'd look at a weekly put to short the market in the morning right after we closed our IWM/QQQ calls, but that it would have to be day traded as the signal was just not strong enough to hold overnight, that was the right call as you can see by the market so far this morning, just because we can be right about a trade doesn't mean that trade is worth taking, unless like I said, you are very aggressive and very nimble.
The Dow-30
We were looking at shorting (Puts) the market around 10 a.m., but most traders chase, they need proof, lower lows/highs so most would have entered somewhere in the red area, a 120 point bump this morning causes some serious fear, for puts those traders would have been destroyed.
Things so far look good on the surface, I still believe the market expects Bernie to say something to soothe the market, but there's not much he can or will do that will have an effect that is more than transitory, yesterday's big break wasn't the first this year, volatility is increasing and this is yet another sign of the turn.
What does Bernie give us...maybe? Some decent opportunities.
As for the opening indications, they had a lot to overcome this morning, but they are starting to move toward confirmation of the open.
DIA intraday is catching up to price
The IWM 1 min is leading
The Q's are leading
The SPY is in line.
The TICK went from -1500 yesterday, today a lot better so far, as expected yesterday. This is why we don't chase, but I think we'll see a better example of that soon.
Of course no one, at least on the sell side , the EU/Troika, Germany, Citi, JP Morgan and especially Goldman Sachs who actually had their tentacles on the levers of power in Italy are happy about the hung parliament elections which leaves Italy effectively without a government. However as we saw yesterday after market there were signs the market was going to gyrate and this morning it will gap up, largely I believe on expectations from Bernanke at 10 am, that's when all important data hits.
The EUR/USD hasn't moved much , but has a floor at $1.30 for now.
ES moved a bit off the lows, we'll be patient and wait for the set up there
NASDAQ futures are also set to gap up.
I suggest watching how the market reacts to Bernie in front of the Senate.
It will be short lived because the cat is out of the box, but he's expected to soothe the market.
Hopefully I don't have to go back and show you all the reasons and hints we have been gathering every day as to why this market is in big trouble, but for some of our newer members (And we are totally full, we'll be getting a new website soon as we can no longer accept new members or at least not many), we were tracking these changes before anyone because "Changes in character lead to changes in trend", so before these were screaming problems like they are now, they were clear hints of problems and taken with numerous 3C charts, market breadth, mass psychology, Remember all of those new dumb money bullish sentiment extremes like the 18 point bull/bear spread on the AAII weekly Investor's sentiment poll? The list doesn't stop, but perhaps the most important and everyone was so busy saying, "Don't fight the F_E_D" that they missed the message the F_E_D was clearly telegraphing since Sept 13th 2012 and particularly the day before the January minutes were released last week.
Many of you know one of our key tools and proprietary indicators is 3C, what you may not know is that the name 3C, while not powerful like the "Elder Ray", is a constant reminder to all of us to, "Compare, Compare, Compare" which is some of the best advice I ever received from one of my favorite, "Street Smart Traders", Don Worden.
For newer members, here's a VERY brief review of some of the things that were setting off alarm bells and red flags and why I have the faith to stick to the courage of my convictions and trust what my indicators are telling me after years of using them in some of the most difficult market environments.
Worden T2 Series Breadth indicators (green vs the SPX in red)-Breadth doesn't lie
The McClellan Oscillator, one of my favorite ways to use this is as a divergence indicator, you could see the divergence earlier, but by Feb 1, everything was coming together.
The Percentage of ALL NYSE stocks above their 40-day price moving average taking a dive from about 85% to 50% now, this is unspeakable horror, but also likely an indication of an oversold condition which would only be good news for us or those who want to set up shorts in to price strength rather than chasing them.
The higher momentum stocks that are represented by the % of stocks trading 1 Standard Deviation above their 40 day moving average, from + 70% to 21%, but the trend was visible long before the trouble, in a healthy market this indicator would be moving higher.
The momentum stocks, % of stocks trading 2 standard deviations above the 40 day moving average, from 44% to less than 5% today.
The 4 week New High/New Low Ratio, obvious trouble there.
Now the first indicator I ever won an award for, inspired by the Turtle Traders and trend trading, my Trend Channel which takes the recent behavior of a stock and creates a channel "X" standard deviations around the mean, a break below the channel is a stop out and stocks/markets rarely come back from these. However for a Trending trade, there's no guessing about where the stop should be, there's no arbitrary stops, it's based on real data and many trades I would have exited at a 30% gain went on to make 4 times that because I followed the evidence rather than my opinion or emotion.
Also in the bottom window is a 10-day ATR (Average True Range), the EXCEPTIONALLY low volatility that was sen during the melt up was as I said at the time, "A Dumb Money friendly market environment", sentiment indicators proved this as well, dumb money entered on an easy market with no volatility and CNBC talking every night about new highs even though they were often 0.10% to 0.30% moves!!! As I said back then, smart money needs dumb money in the market to hand off the shares/risk and sell short to and Dumb money came in to the market in droves.
The SPX 2-day Trend Chanel that held the entire trend until just the lat 2 days, a clear stop out. This doesn't mean the market can't move a bit higher, it means in my experience, trying to capture those minimal gains is the highest risk environment, it's almost ALWAYS best to exit the long that wait weeks or months through insane volatility and maybe capture another 3% is you time the trade perfectly. Currencies and the CARRY TRADE-If yo want to know what Hedge Funds are doing, follow the FX Carry trade or the baskets of several FX pairs. Remember the leverage here can be astronomical so as long as the carry is working, they are making money, but one bad day can send their entire move in to a loss as we will see happened today.
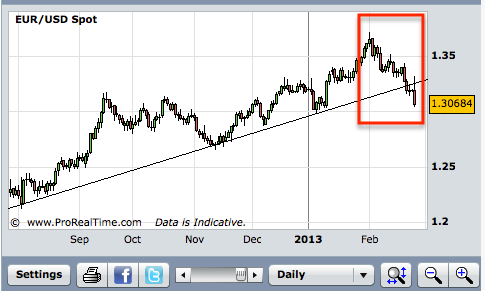
The EUR/USD daily chart, remember the pair moves with the market, the $USD moves against the market, the break of the trend line on the daily chart has been coming and we have been tracking it for weeks.
This is the 5 min chart of the same pair, note the lower highs and lower lows, this is the definition of a downtrend, but few watching the daily chart would have seen this, when the Euro is down and the $USD is up like we see here, it's only a matter of time before the market move down to the correlation.
Here's one of the carry pairs, the EUR/JPY (Japanese Yen)
The daily chart is just now showing the break of the trendline, but the evidence was there long before.
On a 5 min chart of the same pair, we see again lower highs and lower lows until the Euro broke the trendline and sent the Yen soaring as the Carry trade was in huge jeopardy and carry traders like hedge funds rushed to close out the carry which means closing out the stock positions they financed with the gains from the carry trade.
Take a look at today for a clear view of what happens when a carry trade goes wrong and remember for each pip the currency moves against your position, that can be 200x leverage!
Remember last night the EUR/USD opened flat and then overnight was sent higher presumably on Italian exit polling data that was completely wrong compared to the results reported later in the day, in any case, the FX pair lifted the SPX and NASDAQ futures and the market gapped up on the open, apparently CNBC was doing their "DOW, ALL TIME NEW HIGHS IN SIGHT" on the open, soon after though the pair reversed and took the market down with it.*This is where I see some initial evidence of a reversal brewing in the FX pair and the SPX/NASDAQ futures as posted after market.
This is the daily trend of the Yen which has been under a policy of total debasement by the Japanese government in order to make exports more competitive as China has boycotted Japanese exports in a feud over a couple of uninhabited islands.
Look at the daily close for the Yen today!!! This is a total reversal, a +2.29% gain, what's going on? It's the Carry trade.
Here's the Yen via the ETF, FXY intraday vs the SPY in red, the Yen opened lower as we saw last night on the UBER-SUPER-Dovish nominees for leadership positions at the Bank of Japan, however as the SPX fell more and more, the carry trade had to be closed out which means buying Japanese Yen, note the last plunge in the market around 3 p.m., this sent the Yen soaring, I doubt it's going to be a good night for the Nikkei.
As for the US, the fastest way to hedge exposure when you are a huge find and can't sell in to a declining market is to take out protection and it was bid today, take a look at the VIX.
Look at the daily price candle of the VIX today! However this should have been no surprise at all. As far as Technical Analysis goes, the price pattern with the descending wedge suggested the VIX fall further and market rise higher, but we had warning weeks and even months ago as for 1, I told you the positive daily divergence in the VIX is the largest I have seen since the VIX was re-worked to include the SP-500 components in 2003.
But even more convincing...
My DeMark-Inspired custom buy/sell indicator gave a but signal in green, the Bollinger Bands went from huge volatility to a narrow pinching suggesting a highly directional move was coming. At the time of the BB pinch I said, "I'd expect the VIX to hang around this area for a little while, crossing above and below the centerline moving average", in essence throwing traders in to a blender, then as predicted at the buy signal and the Bollinger Band pinch, the highly directional move over the last several days, but today especially.
Another area I look for confirmation is in TLT, the long bond ETF, this is also an important lesson on 3C and why I wait for 3C signals to engage the trade. TLT is a flight to safety when the market goes in to risk off mode as it did today, so if I'm getting distribution signals in the market, I should be getting accumulation signals in the safe haven assets like TLT.
The SPY in but one of many confirming charts, from left to right: Green=3C/Price trend confirmation, red arrows=distribution and on this timeframe, it's heavy. The white arrow=accumulation which happens to be at the market wide 11/16 new cycle low, which saw a head fake move to a new low after several weeks of accumulation so it was set long before price moved a usual and that's our edge. As I always remind you,"PRICE IS DECEIVING", as you can see the new price highs off the 11/16 cycle low were not only negative divergence with the price trend, but lower than the 3C readings at the September top, which just so happened to be the same time QE3 was announced-that's right, we had a negative signal at the announcement of QE 3 and I had a number of emails telling me not to fight the F_E_D, but a day later and the market maxed out and headed down from there.
With a negative divergence in the SPX, money should be coming out of risk and in to the flight to safety trade, TLT.
Here we see a number of smaller negative divergences at tops and then a strong relative and leading positive divergence that was accumulated between the prices of $118 when the divergence first started to $116 at the lows in price.
I have told you often that in my experience, wherever yo see a divergence start, such as $118, the asset is typically going to surpass that point, so even if you were to buy at $118 and again at $116 on a continued positive divergence, the average is $117 cost and TLT moved not only through the average, but past where the divergence first started ($118) to close today at $119.33.
What about Gold? This was one of the day's best performing assets as ALL 10 S&P sectors closed in the red. Anyone who knows me knows that despite some of our biggest % gaining trades being in gold, I actually hate to analyze gold and silver because of the insane manipulation of both, however something moved me last week as I posted several posts and positions WAY out of character for me just in the last week or so.
"I still like GLD March Calls here, you can even go with GLD long or some leverage, but I prefer the March monthly calls. Take a look, I'd consider adding here again."
Honestly, does that sound like me, excited about gold?
Then a few minutes later...New GLD Call Positionand tell me this sounds like me! "I know this is not good risk management and I don't encourage it, but I feel I have to go for it. I went with April 20th (Friday 19th) monthly expiration, long $150 calls, full size."
What could make me so bullish on gold/GLD that I was willing not only to trade it, but to violate risk management rules, to add a bigger position than speculative, in fact full size and THEN, ADD A SECOND FULL SIZE POSITION VIOLATING EVERY RISK MANAGEMENT RULE I HAVE LIVED BY?
Here it is...
From a Technical analysis point of view, GLD was in a down trend, then formed a bearish continuation triangle, it broke below the triangle on what I think is a head fake move and then broke below last support, volume jumped as stops were hit, a perfect environment for smart money to accumulate in size, at cheap prices with plenty of supply. I suspected this was a head fake move from the triangle developing, everything since has been in line with that theory.
There are a lot of positive divergences, this is an hourly leading positive.
Basically, someone knew something ahead of time and set up a position in which Technical Traders would fall in to the trap and give mart money their shares on the cheap and in the kind of supply they need to accumulate, we took advantage of that and now the April position is at a 34% gain in a day.
Leading Indicators-As you know they have been signaling red flags for some time, some have been more subtle like the intraday FX charts not seen n the daily, others like Credit have been screaming. I'll post a few...These are all vs the SPX in green, make sure to look at the timeframe or dates.
High Yield Corp. Credit, since the Credit markets are bigger and smarter than equities, we say, "Credit leads, equities follow".
The negative divergence in Credit vs the SPX (in a healthy market Credit should lead or at least stay in line) has been extraordinary, we see it so often sometimes we forget how much it means.
This is HY Corp. Credit with 3C, as I suspected, the yellow arrow on the chart above this one is a short squeeze, you can see distribution now.
Yields are like a magnet for stocks, here yields stopped moving higher with the market, another red flag.
The $AUD, one of my favorite leading indicators among the currencies has a massive leading negative divergence vs the SPX.
The Euro vs the SPX, these two should move together, the divergence is obvious.
Here the Yen was showing trouble, but unless you looked close you didn't realize the trouble it was in.
The $USD is breaking out, this is bad for almost all risk assets, especially stocks.
As you know, I don't generally believe in "V" reversals and a straight reversal tomorrow would be that, although it depends on how futures perform to some degree tonight. So far we have a little consolidation in the Euro and ES, but now the 5 min charts are even starting to move in a positive direction so we'll be patient, we closed out several good trades from Friday, we could have day traded the market today, but I wouldn't have felt good about holding overnight so it wasn't worth it to me, I'd rather wait for a nice set up. Finally...I just can't restrain myself, I wonder what his rap was on Mad Money tonight...
We may get a fresh lesson as to why we don't chase the market, but rather let it come to us on our terms.
The EUR/USD leading positive divergence is holding up, as I mentioned there were early signs ES was picking up on it as well.
EUR/USD today
ES after hours is leading positive
A closer look at ES from in line to a leading positive divergence. Most technical traders chase price and call it confirmation, then they wonder why they get whipsawed out of positions the next day or so. We let price come to us on our terms with a better entry and lower risk.
Since I'm seeing this now, I'll put it out there. The thing that lifted the futures overnight was the EUR/USD pair because of Italian exit polling, when the hard data came out it was very different from the exit polling and the EUR/USD dropped taking all risk with it, however we have another change developing now, why? I don't know, but it will like effect ES and NQ as it already is showing signs of...
This is the EUR/USD pair, it moves with the market, the negative divergence seen at the high led to the pair falling (negative divergence=distribution), we had a relative positive divergence earlier, a leading positive divergence like the one in the white box is a much more powerful divergence and it is positive so it looks like the FX pair is going to be putting in a low and with that likely Futures, although it's a long night ahead of us, this is a significant find.
Many of the charts you see here at WOWS are my proprietary indicator 3C which reveals underlying institutional money movements and often contradicts price. To understand the annotations made on charts, you must first understand that 3C has no numerical value, it is a pure divergence indicator. Positive divergences represent accumulation by smart money, negative divergences represent distribution by smart money and when 3C trades with price, that is trend confirmation.
The chart annotation system is simple; white arrows represent relative positive divergences, red arrows represent relative negative divergences and green arrows represent trend confirmation. When 3C is in a white or red box, that represents a leading positive or negative divergence, leading divergences are the most powerful.
We analyse 3C in multiple timeframes, the longer the timeframe the stronger the accumulation. 1-2 min timeframes represent intraday moves, a 5 min timeframe can represent a day or two and 15 min timeframes average trends of a swing trade nature. 30 and 60 min charts can move the market for a month or more and daily charts can be over a year.
You'll get use to seeing the charts and understanding how the multiple timeframe analysis works and works well.
Welcome to Wolf on Wall Street.
The trades featured here are meant to maximize returns with the least risk and highest probabilities. Unless otherwise mentioned, all trades are meant to be executed at market. I prefer long-term trending trades which perform well in rising markets, but really stand out in declining markets. However, we get occasional one day gifts 30,40,60% 1-day gains. I'd urge you to consider taking some or all off the table in such cases, the markets don't give gifts like that often or for very long. Most of the returns that make the system outperform so well come in short-entry trades. If you are opposed to short trades, this is not the system for you, unless you are ok with buying an inverse ETF. If you would like more information about the truth about shorting stocks, just email me.
Risk management. I recommend a specific and consistent risk management approach to all positions. In most cases we try for 2% risk money (2% of portfolio) unless such a position size exceeds 15-20% of overall portfolio in actual position size. Each trader is different and each has a different allowance of open trades. I like to keep the overall money in the trade around 10-15% of portfolio per position in case of gaps against you. Stops are generally executed at the end of day and I personally never place a stop order, all my stops are mental; remember, the middle man gets to see everyone's cards. When you are not in tune with the market or opportunities just aren't that spectacular, I take my risk per position down to 1% or even half a percent of portfolio value.
Each trader is different and must determine their own level of comfort with risk. I do have a channel stop which I provide to TeleChart/StockFinder users for automated stops, I appreciate you using my links to sign up if you do. The Trend Channel catches trends and works well as it automatically adjusts for each stock's volatility. Arbitrary exits based on nervousness about the markets WILL decrease the portfolio performance dramatically. This system will not ever get you in at market bottoms or tops. The recent 1 year performance against the Russell 2k buy and hold had the system beating it by 3:1. Ultimately it is up to you as to how you proceed, but I'm always available to help you determine what might work best for you.
I do use other scans and systems when market conditions warrant their use and may change strategy with market conditions.
The MOST IMPORTANT tool you have to bring you long term success is RISK MANAGEMENT. There are plenty of articles linked at Trade-Guild.net on Risk Management. We can be wrong 75% of the time and still outperform the market with solid, consistent risk management.
Position Sizing
The position sizes noted in the positions @ 2% risk of portfolio are based on a $20,000 portfolio-adjust as needed. Due to tight stops, there is the possibility, even probability that one position could take up the entire portfolio. You need to decide how many positions you want to trade and reduce the position size according to that. For instance, if you want to trade 5 positions in a $20,000 portfolio, no one position should be valued at more than $4,000-not risk money or 2% rule, but share price entry x shares.
Is interest rates about to start going up?
-
Yes, I know - it does not make any sense - FED is about to cut
rates...but....real world interest rates are not always what FED wants it
to be.
Futures Update BR-EXIT Edition
-
So the conventional wisdom couldn't have been more wrong. Those chasing
risk and closing hedges couldn't be in a worse place right now. I would
still remin...
This website may include stock and market analysis. Any opinions, ideas, views and statements expressed here are opinion only, subject to change without notice and for informational purposes only. Trading stocks carries a high degree of risk. It is possible that an investor may lose part or all of their investment. Accuracy and timeliness of any information is not guaranteed and should only be used as a starting point for doing independent additional research allowing the investors to come to his or her own opinion. Nothing on this blog is to be considered a buy, hold or sell recommendation. *Wolf on Wall Street portfolios are PAPER TRADED, no real money is used. Any investments, trades and/or speculations made in light of the opinions, ideas, and/or forecasts expressed or implied herein are committed solely at your own risk, financial or otherwise. Results are dependent on market conditions, timing and trading style. Comments posted on Disqus Threads are not moderated and are not representative of opinions of authors of this site.
Translation: You are responsible for your own investment decisions. Not anyone else. YOU.
Position disclaimer: Authors might OR might not have position/interest in securities mentioned on this site!
Affiliations:
Authors of this blog might receive commissions and other considerations from:
Correspondents' emails are strictly confidential. The third-party advertising placed by ad networks may collect information for ad targeting. Links for commercial sites are paid advertisements. Blog links on the site are posted at my discretion, without compensation of any kind.




 | Theme by Thur