Tuesday, April 23, 2013

NFLX Update

*Just had a Internet connection loss from our cable company so I relocated, this post is about 15 mins. old.

As expected, NFLX did "Soar" as I was asked in to earnings, had I any idea that it would make that kind of move that fast, of course I would have called it out as a quick long trade, but short covering can really exaggerate moves.

In any case, the initial data back from NFLX this morning tends to confirm my longer term thoughts expressed last night. PLEASE don't get me wrong, I'm not saying NFLX is a short right here, I'm saying I think it's in the area in which it will become one.


From yesterday's email question about NFLX: "NFLX do you think it will roar after earnings again?"

Answer:


IWM Exit

As of yesterday the signals were pointing to some weakness in the first half of the day today, so the early momentum in the IWM was a bit of a gift, the position can always be re-opened later at better prices.

Here's the intraday chart...
This is the intraday chart, so far it looks like the exit was at the perfect time as far as momentum goes. All of the averages look similar this morning, I would not characterize the charts as negative, just short term (intraday) most likely.

IWM Calls P/L


At the $4.58 fill that leaves a +46% profit on the position, as I said, I'm expecting some early consolidation/downside so I'll be looking to add back the IWM position on weakness.

That gives us with a pretty nice ranking in the Options Tracking Portfolio, getting in early before the move and the premiums go way up...
For weekly 5 out of 564 and 14 of 1562.

Closing IWM May 18th $88 Calls for now

I'll try to pick them up cheaper later.

More Macro Economic Bad News


Last night HSBC Flash PMI readings came out for China and were a bad miss and heading back toward contraction below 50, later in the early a.m. the core of Europe itself, Germany, missed on both PMI manufacturing and services, both in contraction below the 50 level. The German Composite PMI came in at 48.8, a 6 month low and well in to contraction.Eurozone Manufacturing PMI dropped 3/10ths of a point to 46.5, making this the 15th month in a row of worsening European Services and Manufacturing PMI, leading many to believe the ECB will cut benchmark rates next month.

You may recall last night I said the Euro looked like it was going to see some short term weakness soon, well that's the reason why, however it seems after the Euro decline this morning a positive divergence is already building in.

Remember the negative divergence in the Euro last night? There's the decline, a positive divergence is building now.

Likewise I said the $USD was set to see some market negative short term strength, that also came to pass overnight and now seems to be getting to resolve to a more market supportive move to the downside as a negative divergence builds.

$USD bounces overnight and now a negative divergence starting that should be near term market supportive.

As for ES...
Last night ES dropped from the 4 p.m. closing level of 1557.75 more than 7 points, than on a small positive divergence around 4:30 a.m. ran to the high of the week, in pre-market there's a negative 3C tone building in. I suppose we may see some weakness until the Euro and Dollar reverse on the divergences each have started.

NQ also dropped overnight in to a positive divergence around the same time sending it higher, but with another negative divergence building in pre-market.

Gold has several positive divergences building this morning after backing off yesterday's highs overnight.

Perhaps this is because Goldman Sachs formerly closed their Gold short recommendation the day after Gold put up one its best 1-day performance in 3 months and best weekly performance in 18 months, gotta love those Goldman calls! They aren't that dumb by the way, they were buying everything retail was selling

We're on track, getting good signals well before events, we need to just stay on track,  take action when appropriate and be patient when appropriate.

Monday, April 22, 2013

Market Wrap

There were quite a few stories today from CAT's abysmal earnings and near +3% close to the symmetry in the market averages, well most of them to the NFLX move, one which I alluded to earlier as a larger trade as the longer term NFLX doesn't look as good as you might think.

Gold had it's best day in 3 months and best week in 18 months, we were positioned perfectly for that move and I believe in the days ahead we will see even greater gains. While I mentioned the market looked like it could pullback tomorrow, maybe the first half of the day or perhaps consolidate, AAPL's charts are looking very strong, if AAPL earnings are anything like the reaction to poor CAT earnings and not as good as you might think NFLX earnings, than we are most likely off to the races, cashing in on positions set up last week and starting new ones in advance of the next move which should be a doozy.

While I didn't know what the larger/longer term problems were with NFLX when asked earlier today, I did think NFLX would break north of $200 and this is the area of our sweet spot. As NFLX's earnings were digested, the problems that I saw on the longer term charts were specifically named, I suggest you read this article...

Does Netflix' $3.4 Billion Off-Balance Sheet Liability Make It A "House Of Cards"?


As to tonight's after hours move, a short squeeze in the less liquid trade of after hours and the reason I don't pay too much attention to that trade for analytical purposes.

We'll look at NFLX in greater detail as it sets up, but for now, here's a quick look at the longer term problems...
You can see exactly why I suspected prices would move above $200, but this hourly chart also shows trouble brewing, NFLX may not be quite ready yet, but it is moving in that direction and today's gains will only hasten that move.


Late day action in Credit, Yields and commodities as well as other Leading Indicators seemed to confirm the charts that lead me to believe we see some softness in the market, most likely during the first half of the day.

SPY charts as to tomorrow's action...

 
 The 3 min intraday chart as it was deteriorating intraday most of the afternoon as I had warned several times, but...

None of that weakness made its way to the 5 min chart, essentially the divide between intraday action and the start of institutional signals.

The most dominant P/V relationships were Price Up/ Volume Down which often results in a one day overbought condition with the next day closing down, however we'll see how the market reacts in to the run up to AAPL's earnings and then of course on Wednesday.

Index futures tonight are on the same course that the 3 min short term SPY chart above had set by the close and are leaking off gradually right now.

AAPL's charts as well as GLD's still look outstanding, what does someone know about AAPL that we don't yet? However as mentioned today, we may see some consolidation in gold after such performance, yet it looks like it still has a full tank of gas to move forward in coming days.

I trust these charts need no annotation, my ugly drawings would just take away from their beauty.
 AAPL

GLD

We may even see another opportunity in silver as something has been brewing over there.

There is very short term $USD strength/positive divergences and Euro weakness, yet this is very short term, the $USD should see downside in the next day or so with the Euro rallying, a market positive environment, however for now that is causing EUR/USD weakness which is risk negative/market headwinds, it shouldn't last long though.

Additionally the $AUD is seeing some weakness and the Yen some strength, this is also a market negative right now, however once again the longer term positives in the $AUD suggest it will come back and offer the market support so futures, FX, leading indicators and the market averages all show 3C charts suggesting near term weakness or consolidation followed by a larger, strong move to the upside, we may find some short term trading opportunities in this environment tomorrow and we'll be watching for them.

Don't forget about UNG as well, this is a great opportunity we have, it may be the last before a stage 2 breakout.

In any case, there's nothing too concerning to me at all, it looks like the charts that matter are still very much where they need to be, just remember that any short term price strength over coming days is a means to a larger, higher probability trade in which we take profits from our longs and set up our new or add-to short positions.

All in all, we have some great signals, just look at gold and you know how I hate to trade precious metals!

Have a good night, tomorrow is another day full of opportunities.


NFLX Gives Earnings Some Bite

After CAT missed today on Revenue, EPS and gave poor guidance (you know what I think as to why it performed the way it did today), but still managed a nearly 3% day, it seems that Wall St. is creating the sentiment to go along with that most obvious of bases, the Inverse H&S base which I can darn near guarantee you was not there by chance.

NFLX had a fantastic report, whether they would have surged over +22% if Wall St. weren't supporting earnings is obviously a debate that can never be settled(sentiment), in other words, "It isn't the news, it's how the market reacts to the news-just look at CAT!).

I looked at NFLX for several people today and was asked whether I thought NFLX would roar in to earnings, my opinion was yes, and to look for a regional high >$200, which it's at $212, but added NFLX seems to have some longer term trouble and the second part of that trade may be the more interesting part, who would guess a +22% AH move? It really comes down to what it does in regular hours, but there are some very interesting possible NFLX trades over the next few weeks or perhaps even sooner that may make a lot of sense.

In any case, the point is more to the atmosphere, the sentiment, the really clear bait in the form of the most obvious bottom pattern that anyone who has even looked at a Technical Analysis book would instantly recognize, in fact some seem more prone to recognizing the H&S base or Inverse H&S more than the top which over the course of the last 100 years has been one of the most reliable price patterns out there (so long as it is correctly identified with volume analysis). Much of the market was fooled by a H&S top price pattern in the SPX from Jan. of 2010 to July of 2010, it was an obvious random pattern as the most important confirmation, volume analysis, clearly showed it was not a valid top.

The point really still going back to last night's post, it seems that Wall Street has set up a very friendly atmosphere inviting longs in, I don't think they'll want to spook them as I was saying last night with short term head fakes and tricks, I think they have their eye on the prize and that is getting retail to trust in and buy this base they have set up (Good thing we were set up for this last week).

Again, the ultimate goal can be summarized by any number of charts, from currency, to Futures to Treasuries, to volatility, market breadth, market averages, or any number of 100 different indications. The prize is an early counter-trend rally as the SPX has finally made a lower low in the 2013 trend and sell the shares accumulated last week in to higher prices, the same thing we want to do and continue selling short in to demand and price strength, again, the same thing we want to do.

I think this was one of the great, "Charts of the day"... from the linked post published earlier today...

Here's the Bloomberg US Macro Data Surprise Index, (Negative vs. Positive data surprises for 2013).


The Index is now at negative lows not seen since November of 2012...
It looked very familiar... This is the Market Breadth indicator, T2108, All NYSE stocks trading above their 40-day moving averages which should rise in to a healthy rally...
As you can see, the percentage of NYSE stocks trading above their 40-day moving averages' hit a high of 85% in January and a low of 37% last Friday, which is also a level not seen since November of 2012...

MARKET UPDATE

After looking at all of the market averages as well as Index Futures, I see the same intraday negative divergence that has been there most of the day. All of the charts that matter and that influence my decisions are very strong.

If I'm not mistaken, then a consolidation or pullback tomorrow through part of the day, I suspect early trade, morning or the first half, would not be unusual, nor would it be cause for concern in my view. If I'm correct, AAPL reports after the close, I believe that this may indeed be the trigger used to explain to dumb money the "out of nowhere" rally that we are looking for and seeing.

I'm not making any changes other than what has already been stated. I'm just going to be... PATIENT

AAPL Update

This is a call position I'm leaving open, we have a +3% move in AAPL today, you see, even an equity position would have been worth it.

As for the charts, I can't find anything I don't love...
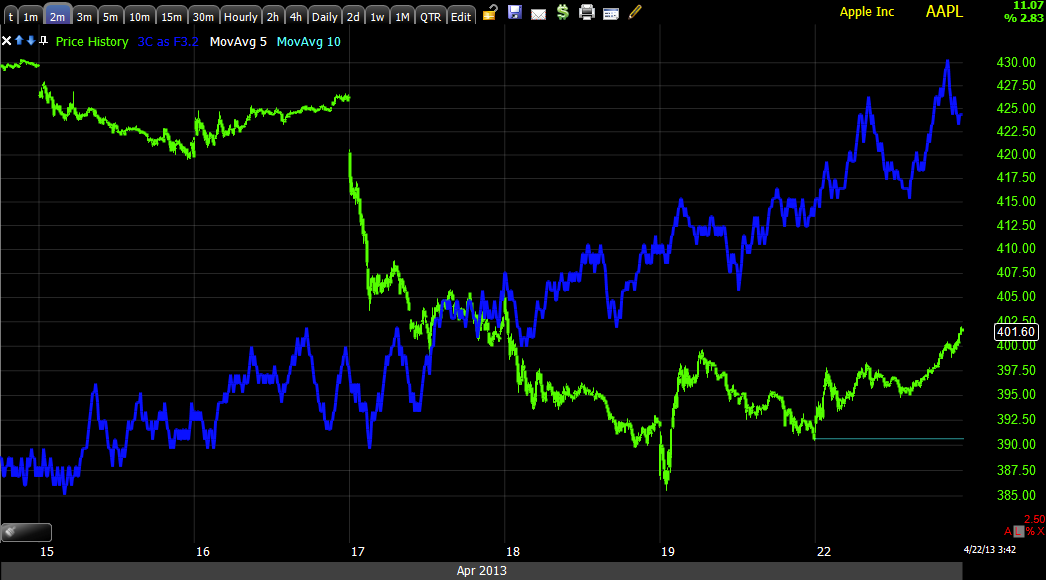
 2 min chart needs no annotation

2 min intraday with confirmation

5 min intraday with confirmation

 The 10 min chart just soaring-these are the kinds of 3C signals you just don't ignore.

And the 15 min chart, AAPL looks as if it is ready to do something huge

GLD Charts

For me, GLD is a bit more of a trending position than the normal options play of in and out ASAP, I see longer term signals, a larger base and a lot more upside coming, that doesn't mean it will be linear with no pullbacks, today saw some consolidation. ON THE OTHER HAND, AS A SHORT SQUEEZE, THERE'S NO TELLING.

Charts...
 15 min GLD has a nice, very strong base with a leading positive divergence, buying started days ago, not last night.


 5 min today went leading positive in a big way, I like this, there's no distribution on the institutional side.

 A closer look at the 5 min today that kept seeing continued positive divergences through the flat-ish range intraday, it looks like more accumulation.

 3 min also looks good intraday


 The 30 min momentum chart for this base is still very well intact.

Futures
 1 min Gold futures look like a pullback, at least overnight, but I'm not too concerned with that.


More importantly the 30 min leading positive is above the level where it saw distribution at higher highs in price.

For position size, I only closed about 25% of the total position.