Monday, August 12, 2013

Opening Update

All of the market averages are now showing negative intraday divergences mostly in the 1 to 2 min timeframe, it's hard to say right now whether Friday's afternoon intraday negatives that were pointing toward early weakness today were resolved on the gap down or whether this pullback that is getting ready to start is part of that as well and we won't know until we see how 3C and price behave intraday on the pullback, we may know very quickly if there's immediate accumulation, it may take longer if the charts stay in line.

I can say that the charts beyond the short intraday charts still have a strong leaning toward the same bounce that we've been expecting and have seen a little bit of already.

So nothing has changed, it's just more a matter of timing.

For now, get ready for the morning gap fills to lose ground.

I'll post a wider update next.

UNG Update

For a position that is both a longer term core "Long" as well as a shorter term Call position, while it may not be what I would write for a financial magazine, my title in this case would be, "It's about time!"

UNG is finally making good on numerous signals with an almost +4% gain this morning off the open and it's LONG overdue.

Here are the UNG charts, I'll be sticking with long positions because this is something that has been in the mix and is long overdue.

 UNG on a 15 min chart looks like it did make a deep-diving stop run around 8/8 with significant volume triggered, as of now, that's the only thing I  can see that was possibly holding up otherwise, very positive upside signals. A shakeout of stops on volume like that is very useful to smart money that needs large supply to fill orders and judging by 3C's disposition, they had been accumulating.

The easiest way to accumulate a lot of shares without driving price up against your position and without triggering a lot of interest from retail traders is to simply look for the area with the most stops and run it.

I don't know why retail screams accumulation every time they see a stock rise on increasing volume as it is simply limit orders getting hit, but when stops are taken out, they never wonder, "Who took the other side of that trade and why?"

 The short term 2 min intraday chart is perfectly in line with the gap up and nearly 4% move today.

The 10 min chart has been screaming the last week, UNG is ripe and ready. It seems that stop run was all UNG was waiting for.

The 60 min chart has had a positive disposition overall and especially recently.

Here you can see the original multi-day charts that signaled a change of character in UNG and first attracted out attention to UNG as a long term long play.

During that same area on a multi-day 3C chart, not only price suggested a large base was being carved out, but 3C as well.

I just feel relief UNG is moving the way it should be, there may be an opportunity to pick some up on a pullback, let me know if you are interested.

GS Update

GS is a core short position, one that has a little room to add (as far as the position size I've built recently).

I looked at GS this morning and considering it's a non-leveraged, equity short, it has a solid gain and I considered taking some profits here to add GS back during a bounce at higher prices, but I remember the last time I tried to get too fancy trading core positions around small bounces and/or pullbacks and gave up fantastic AAPL short positioning as AAPL plunged from it's all time top to a -45% loss. I think it's probably good advice to plan your trade, but better to trade your plan.

After a quick look this morning on GS's weakness I washed the foolishness away and remembered that this is a long term core position, not a trading position. Here are some of the charts I looked at this morning and they reminded me of a few things:

1) We didn't touch GS short for most of this year even though a lot of members asked about it daily, we were patient

2) GS is in one of the best head fake positions right now to enter short; so why would I cover a short when GS is finally in shorting position for the year and at an area in which we couldn't ask for a better set up?

 This is this morning's intraday chart that not only confirmed the weakness this morning, but shows that it was coming as 3C has been leading negative through all of Friday afternoon.

 The 5 min chart suggests a bounce in GS and this is why I considered covering to open at better prices, but with the big picture in GS, this bounce is almost non-existient and really is no reason to try to trade around anything in GS with a profitable short already in place.

The 15 min chart shows the last leg in GS from accumulation in to early July lows to distribution at the price highs.

Many of you have asked weekly, sometimes daily about a GS short and we have stayed away from it for most of the year as it just was not set up as a high probability trade at that point. Having patience and letting the trade come to you are the tactics and signs of a "Wolf-like" trader, stalking it's prey and going in for the kill at the most opportune time rather than chasing anything that moves.

 This is the big picture in GS, it has been choppy, but there's a clear, large triangle and we just talked about large triangles and what they represent late last week, in this case, most often a clear top.

The area in yellow is also something we covered, "THE HEAD FAKE MOVE THAT PRECEDES THE DOWNSIDE REVERSAL". 

While the head fake move in GS would seem to be taking quite a long time, as I have been trying to press as a market CONCEPT, these moves are proportional to the price pattern or trading action. 

In this case a 1 month head fake would not be proportional at all, it's not about Wall Street creating pretty charts that are in scale like an artist's painting, it's about the character of the individual stock's circumstances and how long it takes smart money to move from a new long exposure to net short considering they are trading 10's of billions in GS alone (EACH!), not our typical 100 share lots.


 Money Stream in GS has confirmed the triangle as a bearish top and the move above the triangle which is not at all a technical analysis concept with a triangle this big, but technical traders treat all triangles the same, is in fact a head fake move that has been sold and shorted in to.

The daily 3C shows the same with some more detail.

A closer view...
This is the breakout above the triangle, for most of this year, every time I was asked about GS as a short I said, "Not yet, but it will be".

Clearly the daily negative divergence has transitioned this year from in line to slightly negative to leading negative and this being the right area to be entering shorts in GS.

As a larger general concept, I think a GS short for a longer term trending position can be entered anywhere in this area, but we still look for the best tactical entries, that's why our GS short is in a profitable position even with recent upside moves.

I like GS as a short "Hold", Add to or a new short position for those looking for Financial short exposure.

USD/JPY Pushes Market Lower

Just as we published late Friday and last night, the signals for early market weakness starting this new week have been in place.

As far as the USD/JPY, I showed it last night with the initial move lower on JPY strength and then it reversed and gave the USD/JPY upside room which it took as the knee jerk reaction was wrong.

The official news (and if you look at the charts from last night you know this is not true, it was just a knee-jerk reaction) is that Japanese GDP sent the Yen higher at first and then Chinese stimulus to major cities in need sent the USD/JPY higher overnight, it simply isn't true if you look at the currency charts from last night, but the financial media ALWAYS has to give people a reason for why the market did what it did to make it seem like a simple animal that can be easily understood and tamed.

I suppose it's no coincidence that China is giving stimulus aid (as they have been on a tightening course) just as last night's 20/20 covered the ghost cities (all brand new) in China are at the forefront of a huge property bubble and EVEN MORE, THE SLOWING OF THE CHINESE ECONOMY.

AS USUAL THE MAINSTREAM PRESS IS A BIT LATE.

I found this article on a quick search that we published Dec. 2011...

"From here in the US, looking East we think about the EU area trouble, but as I have been talking about for over a month now, commodity prices seemed to be warning of a slow down in China that was later confirmed by their non-manufacturing and manufacturing PMI, both in contraction."

It's all right there in market action if you're paying attention.

Additional Charts

These charts are diverse, but they all still tell the same story, a short term bounce and in the big picture, it's hardly worth mentioning, but as a part of what to expect this week, it has utility.

First some of our Leading Indicators show the difference between signals for a short term bounce and the big picture which argues for using any short term price strength as a market gift to short in to price strength in a number of assets as these bounces have less and less meaning as we move further in to the big picture, note I didn't say "Closer to the big picture", I believe we are already firmly planted in the start of the move that will be known as, "The beginning of the end" for the market action that has dominated since the 2009 market lows.

 The 1 min HYG chart is not only showing a 3C positive divergence suggesting the arbitrage asset move higher, but it is seeing relative strength vs the SPX which is what actually triggers the SPY arbitrage to help move the market higher, but take note of the timeframe at 1 min and remember that this is a VERY short term outlook.

 Looking at HYG on a 30 min chart doesn't show us the "Big picture" in terms of "since the 2009 low", but it shows us this last leg up from June 21st as we discovered it 1 day before the bottom and reversal to the upside failing and getting ready for the downside move.

Commodities have been out of sync with the SPX for a while, now they are leading the SPX suggesting a short term bounce as you can see on the 1 min chart, but...

Again at 30 mins we can clearly see this last leg up has been VERY WEAK.

Our sentiment indicator for professional money shows the intraday or short term leaning toward a near term bounce, but...

Again, the most recent leg up since the 6/22 lows has shown itself to be exceptionally weak and fragile.

HYG 3C charts...
 The VERY near term intraday action shows a negative divergence, this is part of the "early a.m. or first part of the day "weakness" that we saw last week and that we had clear signals for as noted in the last post on Friday.

 The 15 min HYG chart represents the short term market bounce we want to use as a tactical entry to our longer term strategic positions

And HYG Daily chart shows the extreme weakness in credit more recently and what has essentially become the start of the market move lower.

ES Futures (SPX E-Mini Futures)
 4 hour clearly showing the last leg up off the 6/22 lows being MUCH weaker and moving us to the edge of the cliff.

DIA 2 min showing the exact same at the same rally point, this tells us this leg has been used for what I would call, Extraordinary distribution" which is so extreme, I don't recall ever having seen such large and lengthy signals, basically signals that have never been seen before as we are in a market that is unprecedented and the F_E_D is to blame when we see just how bad the downside is and perhaps the longer legacy is the damage it will do to the newest generation of traders that expect the market behaviour including that centered around the Bernanke PUT  to be "Normal".

 The IWM confirming the ES and DIA signals in the same spot

 The QQQ confirming the same

The SPY's 3C chart and RSI showing the weaker underlying action of the stronger second leg price action.


Sunday, August 11, 2013

The Week Ahead

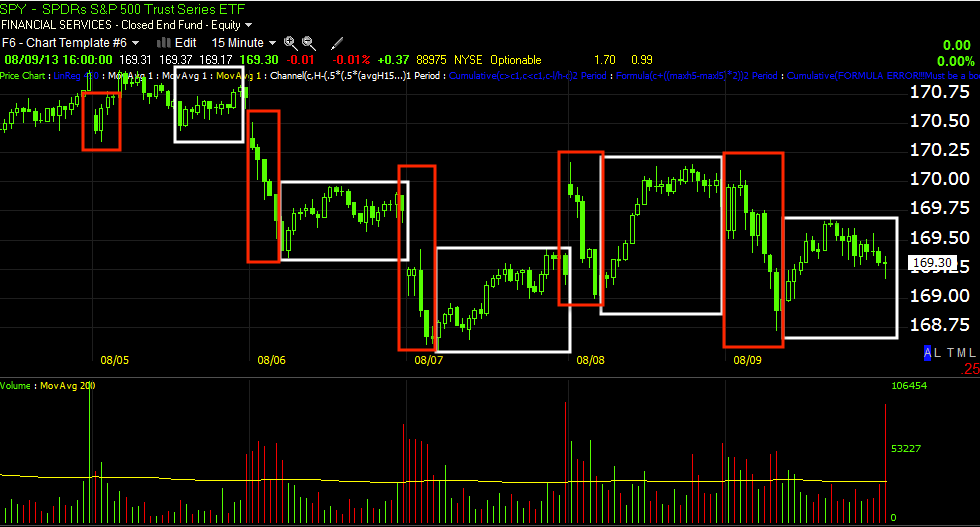
We finished out Friday with this post,  which essentially shows the intraday charts showing the same thing we saw virtually all of last week, even just before the numerous calls we opened and closed August 7th and 8th. The basic pattern of all of last week, even on gap up days, was early morning market weakness which was foretold with 3C negative intraday signals the afternoon preceding and slightly longer charts showing stonger signals suggesting that after initial weakness in the a.m, we'd see market srtrength, this was the dominant signal last week and was the dominant market behaviour.

This 15 min chart of the SPY shows last week's dominant market action, weakness in the a.m. foretold by intraday negative divergences the afternoon before with slightly longer intraday charts in the 3 to 5 min range showing strength also foretold the afternoon before (market weakness in the a.m. in red and afternoon relative strength in white).

This is essentially what we ended the week with Friday as the linked post above makes clear...

"Much like we saw earlier in the week that set up the first round of calls that did pretty well, there's what looks like either closing or early Monday intraday weakness like there has been every afternoon the last 3 or 4 days now, behind that there appears to be the signals for a bounce like we saw earlier in the week"

To start off the new week's futures trade we saw Japanese Q1 GDP miss consensus of a +.9% gain, instead coming in at a weaker +.6%, but as I often warn, "be careful with knee-jerk reactions" and that would include tonight's continuing market action.

Initially the Nikkei 225 futures lost EXACTLY 200 points (similar to the Dow Industrials losing 200 points) as the Yen initially surged, sending the carry pair USD/JPY lower...

 Nikkei 225 futures lose exactly 200 points as the Japanese Q1 GDP data comes out, but is quick to reverse.

 The 1 min Yen futures initially spike (white arrow) in to a 3C negative divergence and then give up all the gains and then some, which did this to the Carry cross, USD/JPY...

Initially dropping substantially in to a positive 3C divergence, the pair quickly regained all lost ground and rallied which is bullish for the market/Nikkei.

US Index futures had no reaction whatsoever.

Gold, which gave some short term signals suggesting a pullback in to regular hours trade early in the week, gapped up, but still has similar signals to GLD late last week.

 Gold futures gapped up on the open of futures trading Sunday, but...

The 5 min chart shows a positive divergence mid week as well as tonight's gap higher and a slightly longer term negative divergence suggesting Gold does see a pullback early this week which initial indications suggested would likely be a good place to enter another short term gold long on the pullback.

The main theme for the first part of the week continues to be the probability of a market bounce.

The 5 min 3C chart of the Yen (which has been seen strength as the Yen is bid up in an effort to close out the USD/JPY carry trade -market bearish) appears as if it will get an early break this week.
The stronger 5 min Yen futures 3C chart suggests the Yen sees some weakness heading in to the new week, this would give the USD/JPY a chance to rally a bit after being beaten down last week, also giving the market some top side head way.

Essentially NOTHING has changed since last week, suggesting a short term bounce that is capped on the upside, meaning even if it can sway retail sentiment to the bullish side, it has little to no chance of being anything more than a short term bounce, which makes any short term market strength ideal to use as a tactical short entry while more nimble traders may wish to hitch-hike a ride to the upside before entering larger short trades.

For example...
 ES 5 min suggests a short term bounce

NASDAQ 100 futures - 5 min suggest the same

Russell 2000 5 min futures suggest the same.

However move to the more important 30 - 60 min charts and nothing has changed, the big picture is still clearly negative making short term price strength useful to enter short positions.

ES 60 min

NQ 30 min

TF 30 min.

We'll look more specifically at assets and entries as well as short term hitch-hiking trades as the initial signals for the new week's trade settle in after Monday morning (typical volatility) trade settles.

Bottom line, NO SURPRISES

Friday, August 9, 2013

Final Update

Much like we saw earlier in the week that set up the first round of calls that did pretty well, there's what looks like either closing or early Monday intraday weakness like there has been every afternoon the last 3 or 4 days now, behind that there appears to be the signals for a bounce like we saw earlier in the week.

It may be that an op-ex pin today kept a lot of stocks from moving low enough in to the accumulation zone and thus it continues Monday, I suspect that because there were so few decent looking candidates except ones that were already knocked on their butt like FSLR.

Then there's the "Playing with fire" warning chart I'll include and it's not just on this one chart, but I figure one should do it. It's fine to take what the market offers, but we can't forget why we are here, what the risk is and I don't want to get crushed chasing pennines in front of a steam roller.

 Typical afternoon weakness on the 1 min SPY, not as bad as yesterday though.

We see it on the 3 min intraday chart too so I expect some weakness in to the close, but probably early Monday too.

The 5 min chart with its positive and this is how the last move was set up.

And a 15 min chart showing a positive, but it's not all that strong so again, be careful

HYG intraday also looks like early Monday downside

At 5 mins though it looks like there will be a bounce and it will support it.

Even here on the 10 min.

This is the IWM chart, there are some even in the 5 to 10 min range that scare me, which I welcome.
This is really the big picture, try to imagine what a bounce might look like and how aggressive you want to get chasing it with this chart in place.

Silver $20 Put Follow Up

I said last night I think both SLV and GLD can rally again, but first they need a pullback and that Silver will probably get hit harder and GLD probably rally harder the next time.

Here are the SLV charts, remember I'm not treating this as a swing trade or anything else, it's a quick move to the downside I'm looking for.

 SLV 5 min chart

SLV 3 min from the accumulation for the move to distribution in to the move.

Futures
 The 15 min SI futures- negative

And the 1 min intraday the same, I'd take the SLV put right now if I hadn't already