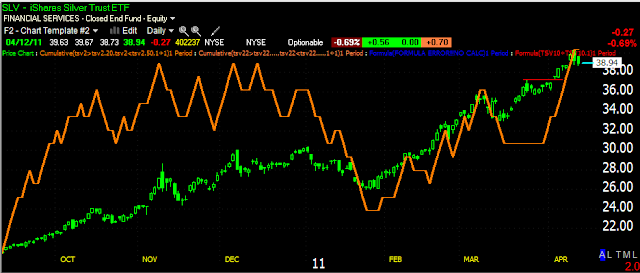
For more then a few weeks now I've been saying SLV has been stronger then GLD, that appears to remain true. We have two pullbacks, but each are of a very different character. First SLV
SLV Daily chart and 3C, there's no negative divergence here, just confirmation of the uptrend.
On the hourly chart, again confirmation
The 30 minute is close to being negative, but more or less it's still confirmation.
The 15 minute is almost perfect confirmation.
Only at the 5 min and 1 min below do we have negative divergences and SLV is pulling back so it makes perfect sense.
Now GLD
First, I included the sell signal on the Stoch/RSI indicator, I didn't show it on SLV because RSI is in confirmation, there's no negative divergence so no sell signal, that's a big difference.
The daily 3C GLD chart looks almost exactly like AA's did, a negative divergence on an important breakout.
We see the same negative divergence on the 30 min 3C chart at the same breakout point.
The 15 min chart is in a leading negative divergence which is the worst kind, while SLV was in near perfect confirmation of the uptrend.
And the 5 min is negative as it should be on a pullback, but I suspect that GLD may experience more then a pullback. Should the support at the $140.75 area give way, we could see a very fast fall in GLD. It would probably be a trade worth looking closely at.
Is interest rates about to start going up?
-
Yes, I know - it does not make any sense - FED is about to cut
rates...but....real world interest rates are not always what FED wants it
to be.
6 years ago


No comments:
Post a Comment