Since the last market update showing some short term positive divergences, the markets are off their lows and in a slow steady crawl uphill.
I just ran a scan, it returned (less oil companies as I'm weeding those out for the time being) 102 candidates that need a closer look, but what seemed to be a common theme was a large proportion of large cap stocks looking a bit weathered and in some precarious situations. As I review and list ideas, you'll ave a better idea. For now, lets take a look at the market, I may also try to see who's reporting tonight and get a glimpse of any underlying action. If you saw last night's video which should have reached your email, then you'd see that AA was indeed one of the very few stocks that I would have called an earning splay on (short) and I rarely call earnings plays unless there's overwhelming evidence/probabilities, but in the past, we've had some very successful earnings plays. I think a couple of quarters ago I wanted to show you 3C's ability to see under price and determine what was really happening. It's not too often that I find what looks like a blatant leak that Wall Street acts on before earnings, but I do believe they are out there and that earnings season we had 22 picks, 20 responded favorably.
Here's the current market update
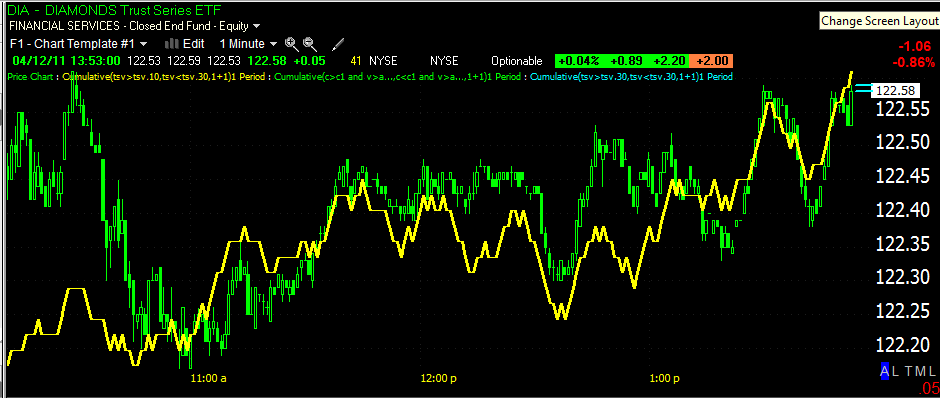
Here's the DIA with a tight view, it shows confirmation since the last update around 11:30 in which we saw positive divergences suggesting an intraday bounce.
The IWM is also showing good confirmation thus far.
The 5 min chart looks downright bullish (still this is on an intraday basis as of now) with a leading positive divergence.
The Q's appear to be struggling a little more then the others, there's a possible negative divergence forming , but it's not well formed as of yet and could fall in line shortly. We'll want to watch for evidence of deterioration, otherwise, at this point I'll assume that the Q's should keep pace with the other averages.
The SPY is also showing a little bit of weakness very recently, but not at the point in which I'd start sounding alarm bells, it's not so far that it can't catch up.
This is the same chart of the SPY, just zoomed out a bit. It looks more positive then the one above because the earlier positive divergence lifted 3C, but in essence what we still have is basic confirmation, there is no leading divergence which would be very bullish (short term/intraday) into a rising intraday trend
To back out of the trees and view the forest, here's the SPY 60 min chart which is quite negative, but the market never travels in straight, uninterrupted lines. It's just important to remember that even should we get a daily bounce/close higher, there's still a ugly problem on the more influential charts.


No comments:
Post a Comment