It's working, the last two days I saw the accumulation, but it was strange looking, until yesterday there wasn't confirmation in the volatility indices or Treasuries, yesterday that came.
Now today, early this morning I put together a composite picture of what I think is going on and thus far everything is moving exactly the way I'd hope to see to confirm that early theory.
Take a look at the DIA, as mentioned earlier, a bullish move in a bear market atmosphere is one of the strongest bullish moves you'll see whether a 1 day bounce or a 40% counter trend move like we saw on the first bear market rally after the 1929 crash, there would be at least 4 more, each weaker than the last, but still very strong moves. They aren't strong because a textbook says they are or because that's what history shows, the market is all about perceptions and as Cramer said very candidly, "You never want to do anything that resembles the truth, you want to create a fiction", so look at today's strength as exactly that, not truth, a fiction and if you think about what institutions that have millions of shares to sell or short, think about what they need to do that without losing money, they need demand that create higher prices so these counter trend moves must inspire longs to take the chance to go out and buy and guess who is selling to them (remember a short sale and a sale both come across the tape as a sale)?

As I mentioned this a.m., the trend line would be the first thing traders key off, the 1 min chart refuses to confirm price strength meaning there's distribution in to price strength.
Just look at the candle sticks and volume as that trend line was broken.
The line isn't drawn perfect, but candles are large, volume is up and fading as we move higher.
2 min chart was positive this a.m., it is progressively worse through the day, the strength of distribution on the 1 min chart is bleeding through or migrating to the 2 min chart meaning the distribution is more serious.
The 3 min chart...
The 3 min chart was absolutely positive this a.m. before the move through the trendline, now it is seeing migration of the negative divergence. This is perfect for the theory I put out this a.m., which was based on the way Wall St. works, not a wild guess.
The 5 min chart is still positive, but I can tell it's losing momentum, soon it will turn negative
If you are having any doubts about the tactic (because the strategic outlook is already clear, now it's about the tactics of putting trades together to match the strategic outlook), then look at this very long, very important 4 hour chart, there's a positive divergence right at...Can you guess? The June 4th low which was also a head fake move and now a leading negative divergence in to the DIA at this top area.
I have no problem positioning for this, this is exactly why the core shorts were so successful, we've only had 3 really good opportunities this year to get in at pivotal moments and a 4th minor one, the rest of the time we have been killing with short trades waiting for this moment.
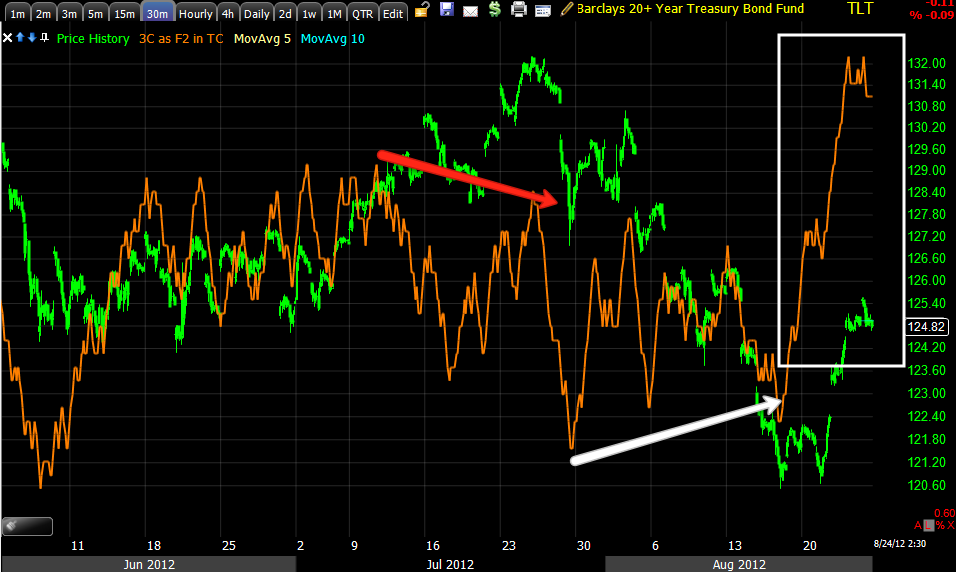
Now, here's your confirmation, TLT and VXX, they should look roughly the exact opposite of DIA, remember DIA short term timeframes are turning negative, the important strategic ones are already negative, TLT and VXX should look the exact opposite for confirmation.
TLT-Treasuries, the Flight to safety when the market goes down.
TLT 1 min, as the market averages like DIA were turning positive, TLT turned negative, but not nearly as negative as the averages, just enough to complete the arbitrage opportunity, not enough to really be selling the accumulated position in any size. Now as the DIA 1 min goes negative in to the move up, TLT goes positive in to the move down-
PERFECT CONFIRMATION.
TLT 3 min is going positive as the DIA is going negative, in effect as the positions are being sold/shorted in the DIA/market averages, new positions are being opened with the short proceeds in the assets expected to benefit from a drop in the market.
TLT 5 min, as DIA went positive, TLT went negative, but the TLT divergence isn't nearly as strong and now it's turning positive!
Look at this SPECTACULAR Leading positive divergence in the 30 min TLT, just the opposite of the long term negatives in the DIA. That's a new leading positive high!
VXX
VXX 1 min goes negative as DIA 1 min is positive, and recently as DIA is negative VXX 1 min goes positive
Same with the VXX 2 min
The DIA 5 min is still positive, but VXX is NOT negative, it is in line, it is moving toward positive faster than DIa is moving negative.
Long term 30 min VXX at a new leading high positive divergence.
I absolutely love when the market shows its hand, it makes it so much easier to plan and to have confidence in those plans.


No comments:
Post a Comment