I have a lot of exposure to Energy on the short side so this isn't a trade for me, but if I wanted exposure to the sector without stock specific risk (there are ETF risks too), then the oil services looks to be an area of interest.
I personally would prefer a short position here rather than a put, just because of the lack of a clear set up right now and a more general overall negative tone that I think may be longer lasting.
The daily chart and a gap that OIH crossed, this may be the area bulls were looking for a breakout move, meaning this may be a decent size bull trap, so the trade is by no means too late.
Using the daily trend chanel that held the entire move up, the break in the trend for OIH is a close below $40.45 and if I were short on a swing trade, the stop would be $41.45, it would be wider for a longer term trade and I prefer wider stops with fewer shares.
From the macro to the micro, the 4 hour chart shows a significant leading move down at the rcent top, this would be the distribution seen in a head fake move. I don't recall recently seeing any 4 hour charts with this extreme of a leading negative divergence.
The 60 min chart went VERY negative in the same area, the head fake/bull trap area.
Same with the 30 min
and 15 min, this overall looks to be a sound trade strategically.
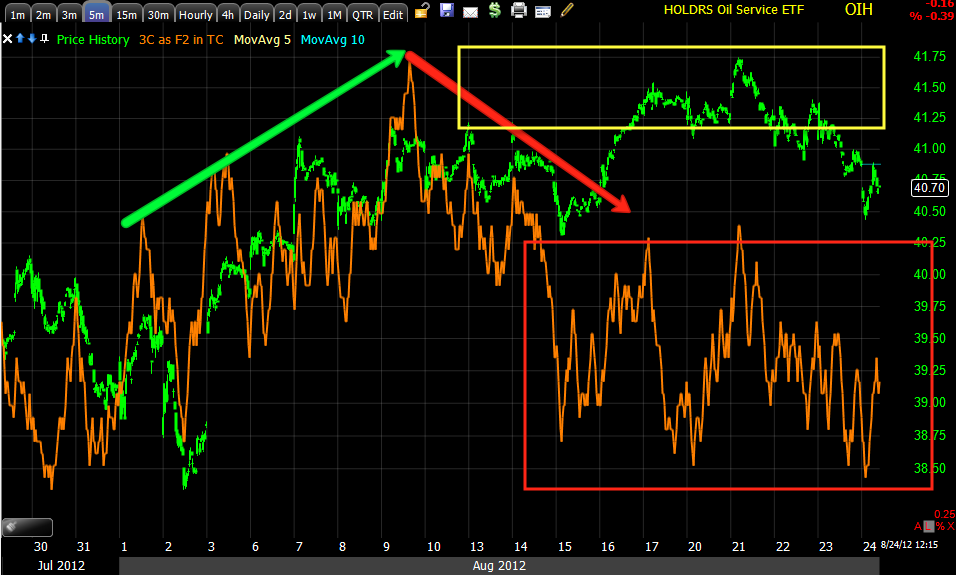
Look at the detail the 5 min provides, as soon as we move in to a head fake area, distribution
Now the shorter term charts and why I would look at this as a position that maybe you phase in to and why I prefer options, you may get a bounce and be able to add at better prices, but right now it is in line and there's no signals for a bounce. It's kind of take it or leave it.
2 min chart is the same
A is the 3 min.
Remember it hasn't broken below the head fake area yet, that's where the momentum to the downside will be, so it's still in a decent overall position, but not one that I find appealing for an options trade unless you have a long term horizon.


No comments:
Post a Comment