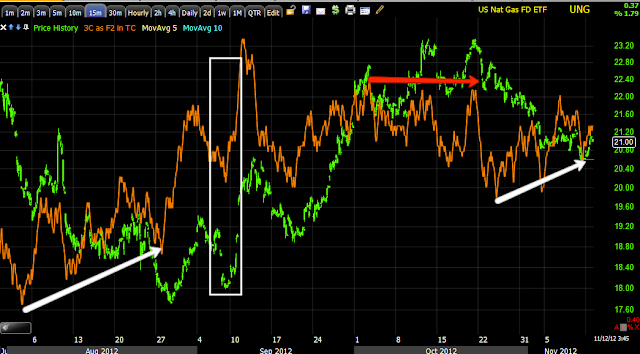
If you spend too much time trying to thread the needle here you'll be left behind.
There are a lot of reasons Natural Gas is an interesting choice for a bull market in the coming years, I won't get in to that, just where we stand now.
The 5 day chart, I think you can figure out what we like about this, there's a change in the air.
Take a look at the rough trend, for me, anywhere around that bottom support line is good enough to start or add to a long position, in my opinion we are still in the Stage 1 Base and have not entered Stage 2 mark up where the real trend and move starts.

Our M.A. Crossover system with a long signal.
Out Trend Channel Stop with a custom indicator that shows the "Close within the bar's range" on a 5 day chart, obviously becoming more and more bullish.
The 3 day 3C chart, don't ask why, but I've looked at a lot of charts and this seems to have the most confirmation, that's a huge leading positive.
60 min and still in the base as far as I'm concerned, it needs a high volume day with a decent price percentage gain to attract buyers and enter stage 2.
15 min with a recent pullback, nothing to worry about in my opinion, just an opportunity.
10 min is the same.
And the more detailed 3 min. I think this is as good an area as any to start or add to a long in UNG, just remember it's a base, it's volatile, it's longer term.


No comments:
Post a Comment