This should cover at least the next day I'd think.
i'll use the SPY as a little more in depth example and then the others I'm showing you where there's some short term strength and where it ends and gets very negative, basically what little gas there should be and the roof on any move higher or bounce is more appropriate I think.
Essentially, this is a market gift IF IT CAN HOLD...
SPY 1 min, there's no strength here at all, it's noisy and messy.
Only once you get to a 3 or 5 min chart do you see some positive divergences clearly so that should provide for a bounce which can be used to short in to for those who are not totally prepared or may want a shot at an AMZN.
The SPY 10 min, the next timeframe is negative and leading at that so this is the roof on the bounce, it can only go so far with so little accumulation.
The SPY 15 min represents where the trend really is going and this is why I'd use this time and any price strength as a way to enter positions for the bigger picture above.
IO'm not showing you the worst, I'm just showing you how much worse it gets just barely beyond these very short term positives.
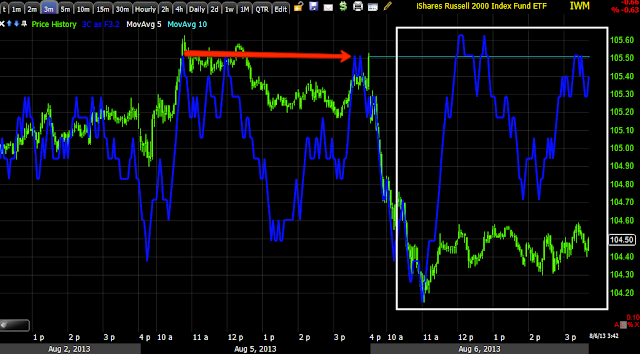
IWM 3 min positive, 1 and 2 min are sloppy like the SPY.
15 min IWM, there's no question about what the highest probability trade is and why we should look at using ANY price strength for better entries like AMZN and maybe some quick longs.
QQQ 1 min has no strength left
It's the 3 min like the others where the divegrence is.
At 5 min QQQ, you can see what happens so there's a roof on how far this can go and it looks pretty darn low.
Is interest rates about to start going up?
-
Yes, I know - it does not make any sense - FED is about to cut
rates...but....real world interest rates are not always what FED wants it
to be.
6 years ago


No comments:
Post a Comment