Also early in the session, the F_E_D's President of the Boston F_E_D, Rosengren also warned of the consequences of QE, it was slightly hawkish, but more just a common sense comment that the F_E_D must consider the costs of QE.
The market bounced off early lows on what most presume to be a POMO operation, but still all of the major averages closed in the red from -.13% (Dow) to -.42% (Russell 2k) with only the NDX closing green at +0.12% while the momentum heavy transports closed down -0.53% after a solid run on the upside.
Some things I've been paying attention to include the $USD which has been up since the F_O_M_C policy statement in what would be considered a "Taper on" reaction ($USD up, Treasuries down and gold down has been the theme), however this looks likely to change shortly which would likely support our new GLD/GDX long position as well as our USO long and general equity risk on as the historical legacy arbitrage of a lower $USD typically helps these assets (gold, oil and equities).

See my last post and the 30 min Gold Futures chart for the positive divegrence there as well as the positions entered Tuesday in GLD/GDX.
And the Treasury Futures also look set for a bounce higher...
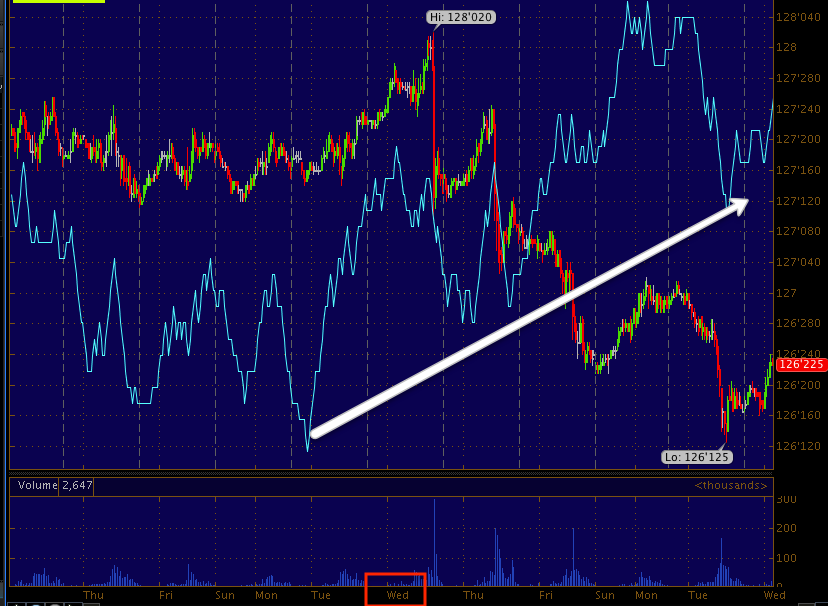


This bounce probability is similar to the GDX/GLD bounce and $USD pullback, I believe it to be short term before reversing, but still a high probability.
This would suggest equities make a move higher as well, I have seen a few signs suggesting the same.


IWM leading negative on the last cycle from the 10/9 lows shows serious structural damage in the market and the path of least resistance to be to the downside, yet like other assets in the very short term such as GLD, GDX, $USD and TLT... HYG's short term chart...

I'm also starting to see a reach for protection, even as I expect short term risk asset upside, USO is a great example of a risk asset I expect to move up, especially on $USD weakness. VIX futures are seeing accumulation and while I'm not ready to call a long in VXX short term, there are positive divergences building.

USO is already a long position, but if you haven't checked it out yet, I'd consider doing so soon.

 Shorter term 5 min building and looking very much like USO is finally ready to make a move, a falling $USD will be helpful.
Also supporting near term upside is Tuesday's Dominant Price / Volume Relationship among the components of the major averages, Tuesday saw a dominant theme of Close Down/Volume Up, which is most often associated with short term capitulation and a move to the upside off what some might call an oversold condition.
However, even with conditions pointing toward a bounce in equities, many indications are still very damaged including Credit's lack of enthusiasm, it has diverged from the SPX/market and credit most often leads and equites follow so I still would be unwilling to close the trading leveraged shorts put together including SRTY and FAZ.
HY Credit was less enthusiastic on the closing ramp EOD in the SPX on a VXX smack down.
Sentiment indicators remain bearish and especially in to the closing action as the SPX made an attempted closing ramp, sentiment indicators went the other direction.
Yields also remain firmly negative and are a great leading indicator.

While I'd expect some bounce in commodities on a USO and PMs bounce, I don't think there will be enough to undo this leading negative signal in commodities vs the SPX for the same cycle.

Commodities are leading positive at the lows of the cycle and deeply leading negative at the highs of the cycle.
We'll take a closer look at the averages tomorrow, they are not clearly positive and are probably among the weaker of risk assets of all listed above (Gold, Miners, Credit, Oil, etc).
For instance, among futures, while the 5 min charts are in line and consistent with upside gains...


Even if I had decent signals in the averages, I'd be very hesitant to play any long as we saw futures get knocked down pretty good just on fundamental Chinese monetary policy news that we already basically new since 10/18. In other words, there's so much damage that even with decent signals, the chances of a collapse because of all the longer term or larger flow chart damage is just too high.
Just as important, it's the Leading Indicators on several timeframes that are standing out the most, they do have some short term positives along the lines of what has been covered in gold/GLD/GDX, but the cycle shows significant damage and the longer trend for 2013 and even since 2009 shows SIGNIFICANT damage.
I'll post those in the a.m.
I'll be working from the hospital waiting room tomorrow, but I don't anticipate any disruptions.


No comments:
Post a Comment