I'm back, I've been looking at the major average as well as some manipulative assets like HYG and trading positions which include SRTY, SPXU and FAZ long (3x short R2K, SPX and Financials respectively).
First, my gut feeling of the market's strength or lack of it on such a blatant manipulative move overnight has by and large been confirmed. I suspected that if whoever is pumping the market had to resort to a tactic like that, the pros would feel what I felt, "This is a weak market" and they'd sell in to any price strength.
This is above and beyond my analysis in the Daily Wrap from last night. What I mean is that my analysis of the market yesterday/last night was that there were several things in place like a negative divergence in the $USD, positive divergences in Treasury futures and positive divergences in gold that told me the probability for risk assets was for a bounce, I believed gold, oil, miners and Treasuries would very likely see that bounce as most have today and the atmosphere would be conducive to equities seeing a similar bounce and that it would likely be short in duration, but probably last several days.
Today, thus far it seems that this mini-cycle has been totally changed by what happened overnight. My gut feeling thus far from what I've looked at is that any price strength is being sold in to faster than I would have expected based on last night's analysis and I suspect it's because of the "seeming" desperation in resorting to such obvious tactics as we saw in last night's ramp.
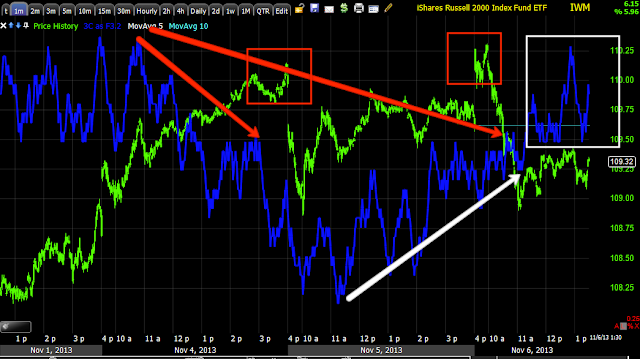
The weakness is apparent in the SPY and QQQ, however the IWM is different, it actually is showing some intraday strength. I'll put those charts up. Additionally, I looked at the trading positions in SRTY, SPXU, FAZ and TECS (long) which is like a 3x leveraged short position and while there are signals for short term pullbacks, it seems to me from the charts that the damage is so severe that it's not a wise idea to close these short positions. After all, the distribution in to the overnight ramp's is more extreme than I would have otherwise expected had the bounce come from things like $USD weakness and HYG strength.
Some market charts...
SPY
Intraday weakness as mentioned, 1 min
Intraday weakness at the a.m. highs, 2 min
Same a.m. weakness in to a.m. highs 3 min
SPY 5 min negative
SPY 15 min chop zone and a leading negative divegrence at the highs of the zone
QQQ
Same intraday weakness 1 min, distribution in to s.m. highs.
QQQ chop and negative divergence 3 min chart, same as the SPY's theme
QQQ 5 min distribution continuing at the top of the range today
QQQ 15 min leading negative, this is a more serious divergence
QQQ 30 min should be obvious.
IWM is the one showing a little different near term action
IWM 1 min distribution at highs with accumulation at the lows intraday
IWM 2 min also showing intraday lows with a positive divegrence.
The 3 min defining the chop and associated divergences.
5 min chart showing overall trend turning from positive (for the chop) to negative
IWM 15 min clearly negative.
IWM 30 min leading negative on a serious timeframe.
The IWM obviously has some better looking intraday charts, but when looking at the short exposure trades like SPXU, SRTY, FAZ, TECS, I felt the short term charts don't compete with the mid-term charts that I really have been judging these positions by, in other words any short term IWM positives do not compete with everything else so I will maintain these short oriented positions and not be thrown off by very short term data that is really more in the IWM than any where else.
Is interest rates about to start going up?
-
Yes, I know - it does not make any sense - FED is about to cut
rates...but....real world interest rates are not always what FED wants it
to be.
6 years ago


No comments:
Post a Comment