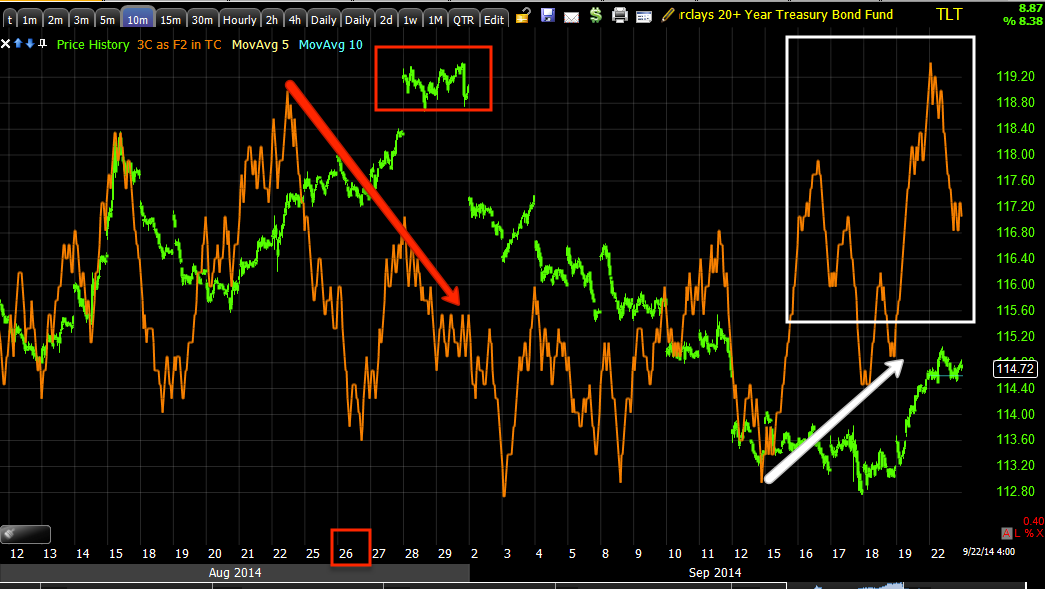
For any who aren't already familiar with these concepts as we use them every day, here's an example using TLT, which we originally put out a "Pullback" warning on August 26th, TLT / Treasuries. If you look at the post from 8/26, you'll see the longer term charts were all in good condition and only shorter term charts were negative suggesting a pullback. Once a pullback starts, it will almost always surpass the area in which we first identified the divegrence even if the divegrence wasn't mature, TLT pulled back further than our initial warning so even an early TLT short on the 26th would have made money. *This has some severe implications for the broad market.
While we expect a pullback and not a reversal of trend, we can only verify that as TLT pulls back and check for the accumulation that should accompany a pullback.
The first HINT of a positive divegrence in TLT came September 9th, TLT-20+ year Treasuries , Update although this was only telling us that the pullback was likely in fact a pullback, not giving us a strong reversal signal.
By September 11th, the divergences needed to suggest the pullback was ending were starting to form and TLT, although just recently turning up, has nearly surpassed that area where the first stronger "end of the pullback" divergences started.
Here are the charts and the concepts of multiple timeframe analysis using TLT, which was just posted in Friday's Daily Wrap and earlier in the Week Ahead (so this is timely for those interested in TLT long,
From the "Week Ahead" as part of the week's Dominant Analysis...
"The daily TLT chart with out initial post calling for a TLT pullback on 8/26 , the pullback and recent posts calling for an upside reversal which we got today. This should send leading yields lower and the market is attracted to them like a magnet as we saw this week again."
However for near term TLT analysis and it's effect on the market short term:
"recall our recent posts that TLT was about ready to end its pullback and move higher, well it did so today with a +1.27% move and that's with giving quite a bit back this afternoon as we forecasted earlier today for a short term correction allowing a long entry."
Today TLT closed up +0.10%, losing momentum and forming a reversal star candle, right in line with TLT's major trend and minor trend, which has market implications which are in line with both trends.
So far so good for the initial TLT pullback theory as the pullback from 8/26 looks to be over and verified as a pullback.

Note the upside down Igloo with a Chimney (head fake move) in TLT's base and the positive divegrence throughout sending TLT higher least week. Also note the smaller, most recent negative divegrence along the lines of the short term correction we predicted Friday in TLT.
So far the longer term 5 and 10 min charts confirm a pullback that is complete and very short term correction as we suspected Friday making TLT a good looking long still as a slight pullback will allow us to enter at better prices without chasing the !.2+% gain from Friday. However this also has market consequences as a leading indicator as stock prices are attracted to yields which move opposite bonds/TLT.
So we go to shorter timeframes now that the bigger picture looks established.


And the 2 min chart confirms the same. It seems through multiple timeframe analysis as well as multiple asset as we already know what the averages did as far as their divegrence today, we have a high probability scenario which is in line with Friday's Week Ahead expectations of the major dominant theme being market weakness, but an early in the week bounce as the weaker theme.
Leading Indicators...
Today we expected a bump in the overall theme for the week which is stage 4 decline, some of which we are already clearly seeing in price action, but we have nearly a full day of positive divergences being worked out in the averages, mostly in the IWM which I suspected would try to break it's downtrend line on short term price strength or the minor theme...

The IWM made a lower low today which I'm not complaining about as my SRTY (3x short IWM/Russell 2000) is racking up gains every day, however, to get retail traders off the bearish side of the boat, breaking a technical price pattern usually will do the trick and the IWM's is one of the most visible.
The concept of the break above are still short term only, but when used with the longer strategic charts, they are excellent for tactical analysis in determining the most likely near term price moves and how you want to use those price moves.
Here's a quick look of what we already suspected to be the highest Dominant theme and short term probability with the argument for the longer term probability over the course of the week being made in Friday's, The Week Ahead, DOWN.

Also note the SPX/RUT Ratio Indicator did not confirm a lower low in price, but rather supported the VIX Inversion signal suggesting a move to the upside was likely as well as 3C showing the same and an extremely oversold breadth condition.
The major trend in the SPX/RUT Ratio currently is non-confirmation of higher prices experienced in the "Chimney" or head fake area of last week, so again we have strong confirmation from multiple indicators and multiple assets.
For those newer to 3C, I originally names the indicator as I did as a very basic, but important reminder to "Compare, Compare, Compare". Now I might say, "Compare, Contrast and Confirm" are equally as appropriate, but that's what you find when you compare as many assets in as many timeframes as possible.


The Dominant trend take-away from multiple timeframe analysis is the market's probabilities are to follow HYG and move to stage 4 decline, which the SPX is only about 15 points away from, the Russell 2000 has already entered stage 4 decline, the NDX is about 52 points away from stage 4 decline.

As for the dominant theme in the cycle...


On a longer term view, again, like Pro Sentiment, HY Credit falls apart at the market's head fake move last week forming the Chimney.
More to come in the daily wrap.


No comments:
Post a Comment