Keeping in mind the
Levers post from earlier and yesterday's Leading Indicators which I'll be updating in a few minutes, for the most part the intraday 3C /price action has been in line, however like the overnight fuel dump, there are some larger divergences that would indicate to me some larger chunks going through, again this is more of an event rather than a process which is not the norm.
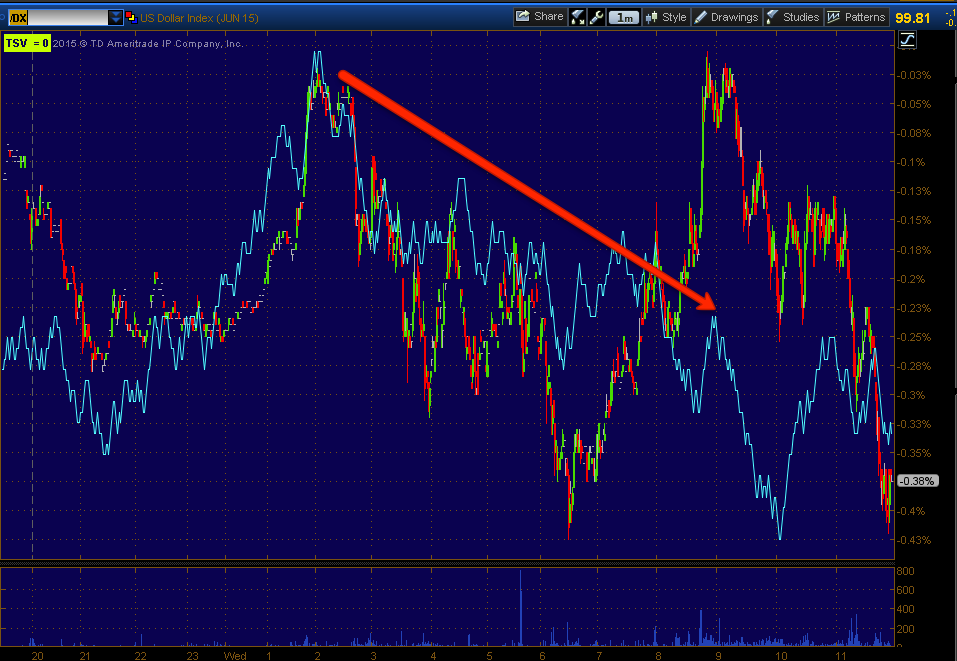
First the EUR/USD as it has just made a pretty nice move, I'm not sure on exactly what yet, but it looks more $USd related to me than Euro related at least as far as the charts go.
EUR/USD pop on a still negative overall divergence.
Note Es (purple) didn't follow the FX pair.
The Euro itself barely has any divergence that would explain the move.
However the $USD does. There are a lot of dynamics around the $USD right now, but on a F_O_M_C day, this is a bit of a strange divergence in my book.
The fact the market doesn't seem to be interested is also a bit strange.
For the most part, across intraday timeframes in the 1-3 min area, the market has largely been in line, for instance 3C 1 min moving lower with the SPY this morning is inline or confirmation.
On a 3 min chart we see Friday's positive divergence that led to the call for not only a bounce in the SPY early in the week (price strength), but rotation out of the IWM which we also saw, but since then, inline.
I'd think there's be some signal of what the market thinks in a distribution or accumulation process, but there's virtually no process, rather moves seem to be showing up on the longer charts that would reflect bigger trades going through or rather than a process, a distribution event. I speculated this might happen if there was still gas in the tank that had not seen a bounce coming in to the F_O_M_C. I suspect the bounce was meant to occur at the same time and for whatever reason (I don't think it can be good), there was huge relative performance divergences between the major averages since the Russell 2000's move last week.
Here the 10 min SPY still has what I'd consider "gas in the tank", but we are seeing larger divergences in longer timeframes like 10 min.
Here's it's more evident on the QQQ 5 min, below 5 min QQQ is largely in line, above where larger transactions would show up, we are seeing stronger divergences and without the process of migration of a divergence or the distribution/accumulation process, indicating larger chunks and more of a distribution event.
We're still not at a divergence that I'd be taking action on at this moment, but we do seem to be getting movement.
The QQQ 10 min which has made a lower 3C low is another clearer example, especially vs the intraday charts that really look to be in line.
Or the IWM15 min from leading positive and a good start on a leading negative.
Also while not as pronounced in the other Index futures, ES 7 min, again a stronger timeframe shows a leading negative divegrence since the cash open.
You know what I've though about this bounce since last Tuesday and I haven't changed my position. Leading Indicators seem to have been in line with that position as well, that this is a bounce and not one I'd want to trade from the long side.
I'm going to check Leading Indicators again because a bit ago I saw some stronger signals that were a bit surprising.
I'll also try to get some pre-Window Dressing updates out like NFLX, USO, GLD, etc.


No comments:
Post a Comment