GLD June 19th Puts are at a double digit gain today, however based on my currency analysis I think it is likely that they put in a small bounce, perhaps a gap fill from today's gap.
USO/Oil theoretically should do the same although I don't see as strong of a case for a USO bounce.
The USO position that's active is the USO short meant to capture the longer term trend, the puts expired last week, which is a mistake I ALWAYS ending up regretting, options with expirations that aren't at least 3-4 times longer than what I think is reasonable,
In any case, don't forget there's also the API crude inventories data out after the close today and there's the EIA data tomorrow morning at 10:30 (oil inventories).
As for gold, the biggest catalyst for movement tomorrow beyond what looks to me to be a corrective bounce in EUR/USD, a corrective pullback in USD/JPY and corrective pullback in $USDX generally.
Of course the F_O_M_C minutes are a total wildcard as even the knee jerk reaction which is almost always wrong can send the trade either in your favor or against you. I personally don't like situations in which I have no control whatsoever and I'd normally take the GLD put gains based on that, but I believe the longer term 30 min $USDX positive divergence suggests more downside in gold and USO over coming days, perhaps weeks. However if you want to protect gains, you can always re-open trades, especially if the asset goes against you short term in something like the typical F_E_D knee jerk reaction or an EIA knee jerk reaction. The $USD's slightly longer term charts suggest that it's counter trend bounce has a lot more to go, thus oil and gold should have a lot more to go on the downside, I'm specifically talking about the VERY near term, as in tomorrow.
The main catalyst (if you understand how the $USD effects USD/JPY and EUR/USD, you'll understand why I see a near term USD/JPY decline and EUR/USD very short term bounce), the $USD and it's near term and longer term probabilities...
The 5 min $USDX chart which has a large positive divergence/base in place which it has broken out to the upside and a near term (likely profit taking) small negative divergence intraday today suggesting a correction/pullback.
The $USDX 15 min (and 30 min chart looks similar) which is a much stronger signal with a large leading positive divergence at a stable "W" base and is still in line.
I interpret this as a short term $USD pullback, maybe overnight, maybe in to tomorrow, there are too many near term wild cards, the F_E_D minutes at 2 pm being the biggest.
However I don't see this as damaging the $USD much and it should resume its counter trend bounce sending gold lower and oil lower.
Since there's leverage (options) on the GLD (put) position, it's more touchy. I am choosing to stay put and let the longer term trend of the $USD dictate the trade plan as this was meant to capture that trend so I'll stick with trading my plan.
This is about the best GLD has on a 5 min intraday chart today forming a small leading positive divergence and a small rounding (sort-of) base. I'm really not too concerned about it.
The larger and much stronger GLD 15 min chart with a huge leading negative divgerence should be the main trend that resumes even if gold does put in a gap fill or better so again I'll take no action and leave the position in place.
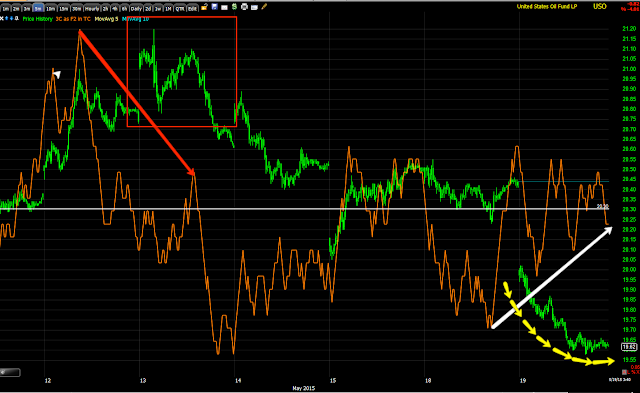
As for USO, this is an equity short with no leverage, not as touchy.
This is the best chart for a USO corrective bounce at 5 min positive with a better rounding bottom.
However the entire trend up since the head fake below support at the white accumulation area to the current huge leading negative divergence tells me this is the dominant chart that will reassert itself even in the case of a USO bounce on inventories or a $USD pullback
As you can see the evidence against any of the positions is all short term intraday and much weaker, it doesn't take away from the probabilities that they see corrections, but the longer term, stronger charts are the dominant ones and their signals suggest much larger trends. Capturing those trends was the plan, I see no reason to deviate, but you may want to take gains and try to re-enter, there's just no guarantee that these corrective moves will play out or they may play out more than anticipated as the F_O_M_C minutes are a total wild card in which we have no control.
However even if the minutes go against the positions near term, the longer term charts and the strength of the signals give me high confidence that the trend I'm trying to capture WILL reassert itself.
Good luck!
Is interest rates about to start going up?
-
Yes, I know - it does not make any sense - FED is about to cut
rates...but....real world interest rates are not always what FED wants it
to be.
6 years ago


No comments:
Post a Comment