Things keep improving intraday once this morning's (
short term) mini capitulation event seemed to occur with one of the most extreme TICK readings we have seen in a while, only a couple of -2000 readings were stronger.
SPY 1 min intraday continues to improve.
SPY 3 min leading positive divergence reflects some of the work done late last week.
ES 1 min has continued to improve since the cash open (
green arrow) .
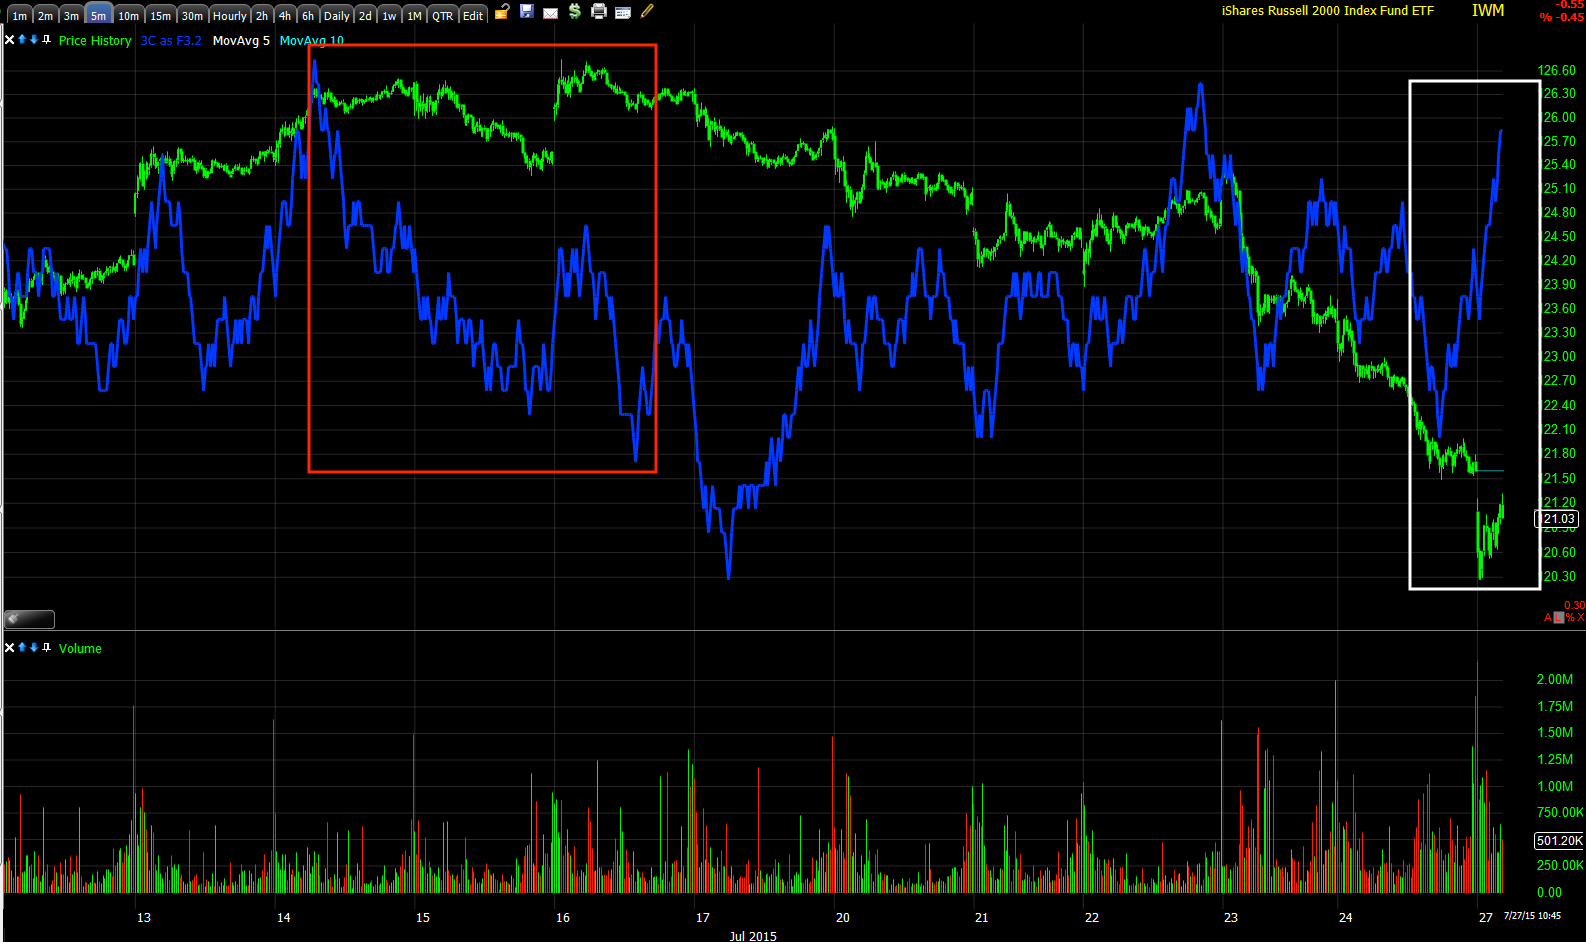
IWM with the bounce top and leading negative divergence on a 5 min chart and to the far right a leading positive divergence.
This is why I liked the IWM over the other averages for a short term bounce and was reflected in Friday's Trade Idea: VERY SPECULATIVE IWM call partial position.
And the intraday TF/Russell 2000 futures chart is also improving.
Interestingly, the QQQ chart on the same time frame is nearly perfectly in line with price action, again the IWM's underlying indications have looked better since late last week and continue to today.
Note the white trend line I drew on the chart. If we were to get an intraday pullback to that area with continued strengthening in signals, I'd be open to adding to the
Trade Idea: VERY SPECULATIVE idea from late Friday.
The QQQ 3 min chart doesn't look bad, but it's still not reflecting the same underlying tone of the IWM or even the SPY.
This is today's NYSE TICK, note the channel since the early open's extreme of -18190, which almost looked like an intraday breadth Flame-Out to the downside or mini-capitulation event. The TICK chart below seems to reflect the same.
Note the change in character in the cumulative NYSE TICK Custom Indicator which has continued through today.
And that same trouble seen last week in Treasuries which would effect yields which have been leading the market, persists with this TLT 1 min chart not confirming and looking like a rounding Igloo/Chimney head fake area here.
Also VXX and this 3 min UVXY chart are showing some intraday negative divergences which would support the correction/bounce theory in the market, however keep in mind at 5 mins, the VXX / UVXY charts are screaming to the upside. So in no way would I consider any possible bounce near term to be anything other than that and I would''t be moving or closing any core short positions or really any option positions that have at least a July or better August expiration. I don't believe we have any open positions like that at the moment, but a bounce would be an excellent area to potentially get a new position started.
Since capturing the charts above, the NYSE TICK (
intraday) looks like it will break the channel to the downside, that could lead to the conditions I'd be looking for to add to the
Trade Idea: VERY SPECULATIVE IWM call partial/speculative position from Friday. Usually right around the European close we get a change in character in intraday prices so it may be a point of interest in any short term speculative long positions.


No comments:
Post a Comment