For longer term members you may recall the 2014 Carry Trade funded rise in Treasuries that saw Treasuries outperform equities for 2014. However something changed in the normally confirmed uptrend in TLT late last year as 3C started going negative in long term confirmation timeframes, soon after TLT topped and started a downtrend. Then TLT broke an important longer term trend line and we've been in and out of TLT a few times looking for a counter trend rally/head fake back above the long term uptrend trend line that broke, before Treasuries head lower which I suspect they will do. There are a lot of more recent dynamics/fundamentals in treasuries and one of the main concerns is liquidity. In a counter trend bounce where a lot of traders are short Treasuries, that decreased liquidity could cause an incredible counter trend rally/Short squeeze, but just as dangerous is a herd mentality stampede for the exits in a thin market creating the same kind of momentum, except to the downside.
I believe Treasuries are going to pullback VERY near term (Yields rise) and this should coincide with the very short term market bounce I'm currently looking for as per the add to position in IWM calls. I believe it's probable that such a pullback offers a long entry in TLT for a counter trend rally attempt, which may offer another trade in TLT. We'll see if A) TLT/Treasuries pullback very near term and B) if there are positive signals in to the pullback, if so, then it may make for a nice long entry in TLT.
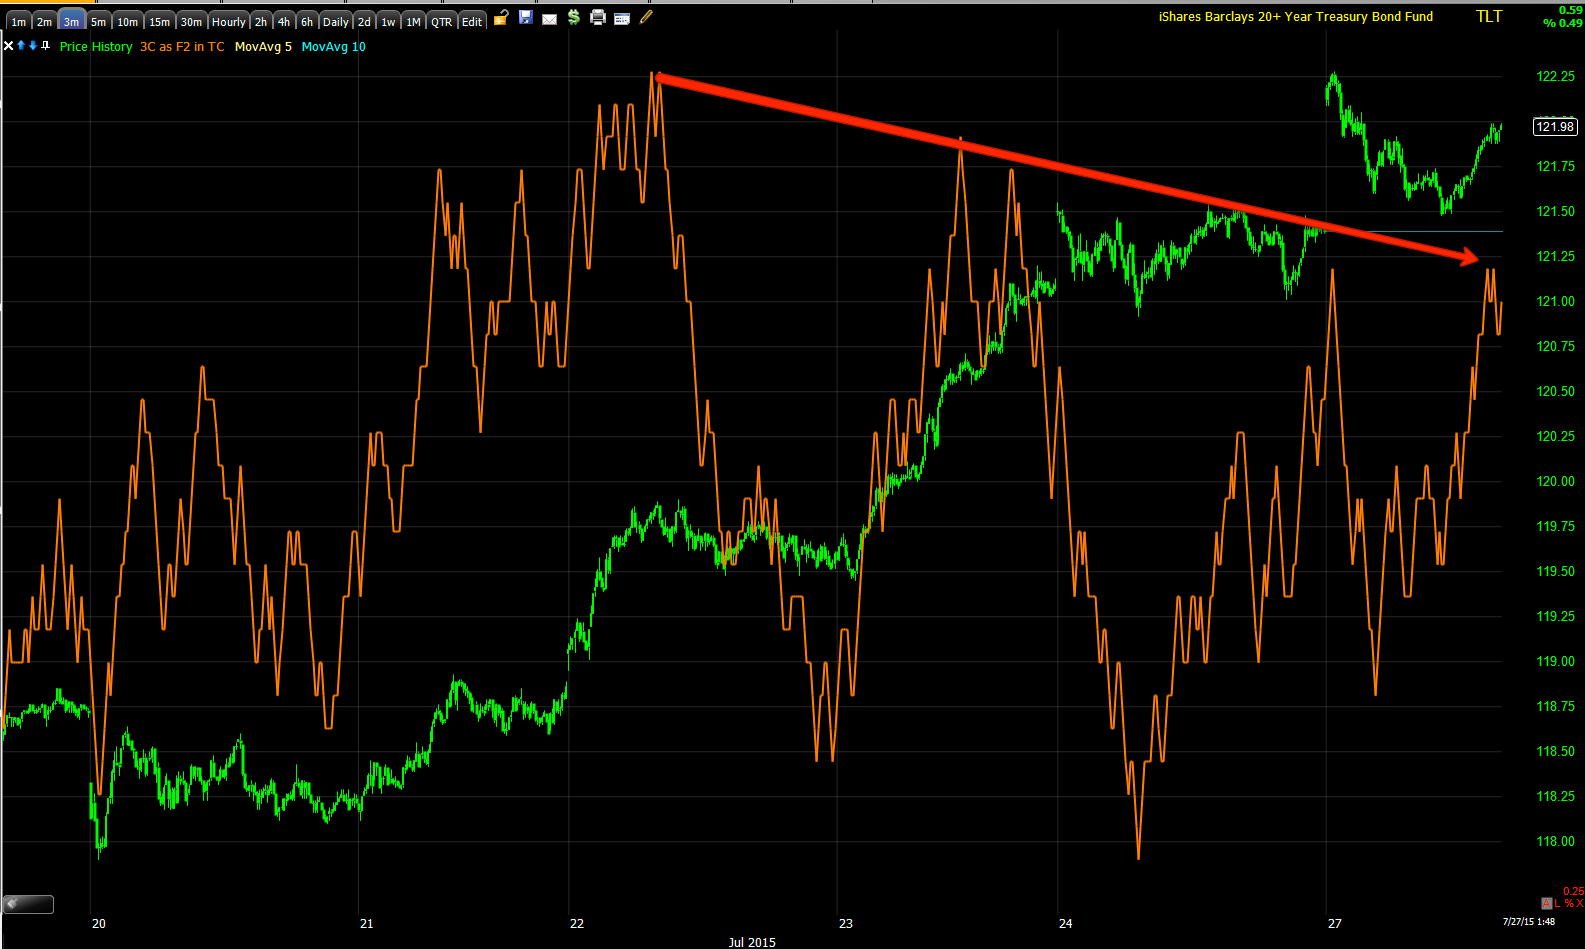
Here's a more complete view of the charts.

I've been expecting a counter trend rally to break above the former up trend trend line and create a short squeeze/counter trend rally before failing and making a new lower low.

This is still, in my opinion, the dominant trend. However counter trend rallies can be incredibly convincing and turn even the most bearish Treasury short in to a long...This is why counter trend rallies exist. See the Dow after the initial break lower in 1929 and the downtrend to follow. There were at least 5 major counter trend rallies, the first was the most spectacular The concept is the same whether the Dow-30 in 1929 or Treasuries in 2015.


The 60 min chart of ZB/Treasury Futures shows the same thing with a bit more detail such as the last accumulation area at the bottom of the range, confirmation of the bounce and recent negative divergences indicating the probability of a near term pullback.


Treasuries and Yields tend to make for excellent confirmation and/or leading indications for the market. In general, a rotation in to treasuries indicates a risk off stance and yields fall as Treasuries are bid. The market tends to follow yields like they were a magnet.
Conversely a pullback or decline in Treasuries typically means there's more of a risk on attitude and money is rotated from safe harbor assets like treasuries and pout to work in stocks, this lowers treasury prices and raises yields and once again, the market is drawn to yields as if they were a magnet.
The catch is during a Carry trade unwind (it was the carry trade expansion that saw Treasuries nearly double the performance of equities last year) we typically see the assets purchased with carry trade proceeds sell off as the assets are sold to cover or close the carry trade, thus the price action and/or normal correlation between Treasuries and the market is likely to change as the cary trades are unwound, which we already see the effects of in TLT as it topped and made lower highs and lower lows. In this case, Treasuries and equities can both decline at the same time as both are funded with carry proceeds and the assets funded are sold to cover or close the carry trade. This is why the USD/JPY and or the $USDX and Yen futures are so important to us right now as this is one of the main carry trades that has already begun the process of unwinding carry leverage.
We'll watch for a possible pullback and long TLT entry as a counter trend rally would give pros the higher prices to exit positions and cover their carry crosses at better prices, but you must always be aware of how fast these can turn as a carry trade usually uses 100:1 to 300:1 leverage so the minute it starts going south and panic starts, it's like a stampede and I suspect this could happen very soon if the SPX breaks its 200-day.
Just be aware of the dynamics and we'll look to see if there's a constructive pullback and entry or whether TLT looks more likely to unwind and head lower WITH equities as both are financed or have been financed with carry trade proceeds.


No comments:
Post a Comment