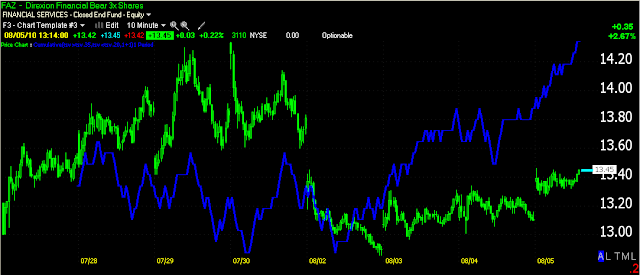
Heading for an intraday breakout?
Below 3C 10 min., 5 min. and 1 min are all in leading positive divergences and FAZ appears ready for an upside move.
Is interest rates about to start going up?
-
Yes, I know - it does not make any sense - FED is about to cut
rates...but....real world interest rates are not always what FED wants it
to be.
6 years ago


5 comments:
It seems as if the support for the day is $13.32 as it has bounced off that level multiple times today already since 10:45 this morning. We may not get a better price or entry point today. Thoughts?
There's an ascending triangle (easier to see on a 1-5 minute chart, but the scale wouldn't let me show it to you with the upper trend line) and the pattern in a bullish continuation pattern. Since the move before was up, that's what you expect at the breakout. The only thing is that if I see it, then a lot of other traders see it too and they may be putting their stops just below the lower support or at it. If the specialist wants to they can run those stops and buy shares cheap plus make money on the spread x volume. So there's a chance that a breakout move to the downside may occur before the upside breakout. Again, it's all about these false moves, getting shares cheap, making money on the spread and using the losses of shorts that will jump in on a breakdown, as they are squeezed when it moves back up-they will cover and provide more demand which will move it higher without any investment from Wall Street to get the ball rolling. So you can always split it up into 1/3s -buy some now, some if it breaks down and recovers and some on the upside breakout or any variation of that if you like the trade.
Regards,
Brandt
Looks like they are looking for those stops today before the close.
exactly-look at the volume on the break of the triangle-putting the chart up now
Picked some up at $13.26 as I was waiting to see if the $13.32 support would be broken.
Post a Comment