Across the board today, with one exception of six averages, the dominant price/volume configuration was close up and volume down among the index components. This shouldn't be a surprise being that this is a bounce, not a rally. The back of the uptrend has already been broken. While many of you have enjoyed some quick profits on this bounce, the point needs to be made, it is a bounce and it is an opportunity to sell short into some strength, even if it is somewhat pathetic. So I have some illustrations for you of what I believe may be going on.
Above we have the daily TRIN Index which closed at .79, this is just on the high side of the range for expected buying into the afternoon decline, remember, I've been talking about this rather strange pattern we've been seeing on a daily basis, more on that in a bit....
Remember, we want to see the TRIN Index around the .70 level into a decline. Here's the TICK Index that seems to back up the readings of the TRIN. You can see the index in been making higher lows while the SPY in red is in decline the last hour of the day-the most important hour of the day. This tends to suggest that the bounce may not be ready to rollover just yet.
As I've been preaching, to make money you must see what the sheep have missed, but as a wolf, you must know how the sheep think. So we will look at two of their favorite moving averages in a couple of timeframes. There is nothing magical about these averages, it's simply because so many traders have placed them on a pedestal that they often create self fulfilling prophecies so to speak.
Here we see support around June of 2009 at the much misdiagnosed H&S pattern that really wasn't. A simple check of volume easily cleared that up, however, that was support at the 200 day moving average. Again around May 2010 we found support in the area, followed by resistance in red and support as the market went sideways-remember that week when I told you the S&P-500 gained exactly 0%? Now we are below the moving average, how do you think most traders view the average right now? Yes, as resistance. This leaves open many possibilities that we can take advantage of if we get to that area.
Here's a closer look. Note the areas in red of either resistance or false breakouts. This is one of the many ways I tell you about, in which Wall Street uses technical analysis against it's practitioners. Currently the 200 day sits at $111.85-remember this number.
Sticking with the 200 bar moving average..
Here's the 200 BAR moving average on a 30 min chart. Remember, technical analysis tends to be fractal, you can find the same patterns on a 1 minute chart as a 1 week chart. So it's no surprise that the 200 bar m.a. works as resistance and support on a 30 minute chart. White =support, red= resistance. Look where we are right now, and look at my version of MACD-the mini double top has lost MACD momentum. We also see an increase in volume as the peaks rollover.

Lets compare the moving average chart to a 30 min version of 3C. The first white box here is accumulation and it is the same period as the first red box of the moving average chart above. At resistance, we see accumulation. The big red box is distribution into the day's highs, this occurs after the white box of support on the moving average chart. Finally the last red box on the 3C chart shows our mini double top, we see distribution occurring there, which confirms the resistance on the moving average chart above as well as the turn down in MACD.
Their other favorite moving average is the 50 day/bar.
Here you can see the many times that the 50-day m.a acted as support or resistance. Often a break above leads to a small rally or a break below leads to a small sell-off.
Here's a closer view, note the first red box and when prices break above the 50 day m.a., a fairly sharp rally occurred, this has a lot to do with trades watching this break above and buying it, or a break below and selling it. This leads to the problems with technical analysis I mentioned, look at the break above resistance around May 2010, it's a false breakout that led to a fast sell-off.
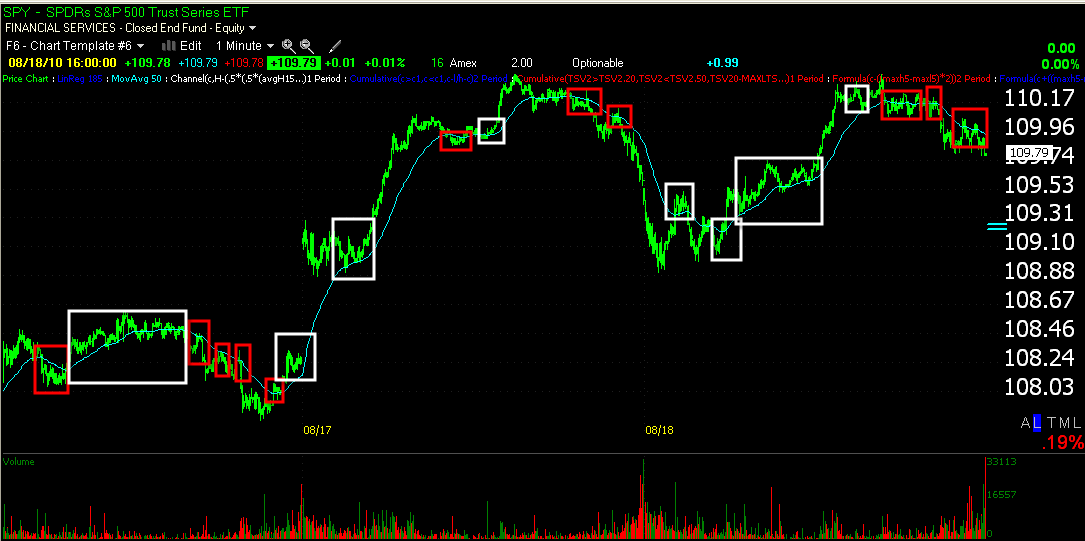
Here's the SPY 1 min chart with a 50 bar moving average.
Again, looking at 3C compared to the moving average, the first box on the left shows price breaking below the 50, you can see we had early warning with a negative divergence in 3C. Next we see 3C giving us a positive divergence in the white box (2nd from the left) while price was under the 50 bar m.a., again we have early warning of the change or character. The red box in between 8/17 and 8/18 again is a negative divergence, and gives us a warning long before the moving average breaks down. the white box at 8/18 shows us a positive divergence and prices move up, again we have early warning before the trend changes. Look at the second to last red box, the negative divergence was extreme, it was easy to see the change coming the last box shows us a leading negative divergence.

Above is an hourly chart of the SPY, we have a clear mini Island top, I always have said, resistance created by gaps in price is some of the best resistance and support you will find. Right now, today's highs hit a decent resistance zone. Look at MACD, the stance is quite negative.
This is the SPY on a 15 minute MoneyStream chart, look at the negative divergence at the resistance zone depicted in the chart above
and 3C.....
3C confirms MoneyStream, this is how we put the pieces together and come up with our opinion of the most likely outcome, by building a case. Right now, 3C is in a leading negative divergence.
Ad you may know, this is option expiration week, the heaviest open interest for SPY calls is at $110 and $112, right in the gap and also close to that $11.85 200 day moving average resistance I told you to remember. The question of where we are going comes down to who owns those calls, if institutional money owns them, then we can expect to see a move into this gap, perhaps above it, which lays the ground work for a false breakout above the 200-day moving average and gives us a great entry point on shorts so long as 3C confirms the false breakout, which I'm sure it will.
Just so you are aware, the core positions I've been featuring are good positions, you shouldn't be afraid of a rally, even one that swings that pendulum a lot further then we might expect. The nature of the market is in a very bad place. Check the charts below.
Daily of the SPY with negative MoneyStream Divergences.
The Q's daily MoneyStream negative divergences. Look at the July rally and compare it to MS!
Breadth indicators are important to to measure the market's health.
The Nasdaq Composite Advance-Decline Line. In red the Nasdaq makes nearly equal highs between mid-June and August, the A/D line is clearly lower showing fewer stocks advanced on the second rally.
At the top, we have the same situation, however on the decline, the A/D line is clearly lower then the roughly equal lows of the Russell 2000 between Mid-July and mid-August as represented by the red arrow. This means on the pullback, we have more stocks in the Russell falling the second time in August. Both charts show a market with fewer stocks participating in the rallies and more stocks falling on the declines.
Finally I want to show you the daily patterns of accumulation and distribution. Normally when we see a rally or a bounce, there's accumulation near some pullback lows and those accumulated stocks are sold into the rally until the inventory is depleted, then they go short and take the market down. WE HAVE NOT SEEN THAT WITH THIS BOUNCE.
What we have seen is accumulation into early gaps down, then selling into an afternoon rally, then taking the market back down to take back some of the gains, the next day the same.
In white boxes, accumulation, red boxes= distribution. Note the accumulation at the 3 pm lows to the left, the next day a gap up and the inventory is sold off. The next day (2nd white box) we see accumulation into opening lows, again a rally and the inventory is sold off.
Here we see the last 2.5 days , again selling to bring the price lower at the extreme left side of the chart, then accumulation into the lows, a gap up the next morning and distribution into the highs, next day repeat and note the two blue hash marks representing after hours trade where it seems accumulation has been occurring at lower prices, fueling a gap up advance.
This is strange behavior in the market, I don't believe I've seen this before. My opinion I stated several days ago was it was like the market was terrified to hold the usual bigger position they accumulated once. Then it came to me, when looking at charts of the dollar vs. charts of oil. It seems clear that the market is afraid that Israel may attack Iran's nuclear facilities, thus they don't want to be be left holding any large positions, this may also limit the scope of the bounce, but that all depends on who's the majority owner of them. With the VIX having been so low recently, I suspect the calls were fairly cheap and perhaps institutional money bought them, if so, then we can anticipate a move above $110 and perhaps above $112. After that, we have our strategy and I'll be listing even more, tons more short ideas at high probability/ low risk. Until then, the market is playing this literally one day at a time.
There are certain positions that may be worth holding and trying to get a decent trend out of them on the long side, email me if you'd like a second opinion, but now that you know how the market is functioning, think about trading in like manner. There don't seem to be huge gains to be made but I know we had at least one 5+% trade today, I'd pocket most if not all of those small victories. We just don't know what will happen in the middle east and it could be the catalyst to take this market much lower if anything were to happen. I hesitate adding longs. I'll run my scans and if anything great appears, I'll list it, but any gifts from the market should be considered as potential gifts that may not last long. This isn't a good bounce to trade, it's really a very difficult one to trade, so if you are making money right now, excellent for you, I know many of you have emailed me with some great trades you've taken and all of you have been very smart about managing them.
I must however reiterate two things, 1) Use price strength, especially when I tell you a negative divergence is setting into a rally, to look at the short ideas and start building position in them. And 2) Above ALL, this is the time to be extra conscientious about risk management. Positions must be in scale to the bounce, you must consider the possibility of unforeseen news that will not show up in 3C, Israel will not tip off the market and risk a mission like this if they decide to go forward. This is exactly why the market is taking things 1 day at a time.
We have few indications as of now that we will see a gap up tomorrow, only the TRIN reading which is at the high end of the range for a move. We have strong resistance, I think this will come down to who really owns a majority stake of those calls at $110-$112. If it;s smart money, they'll take the market there, but I haven't seen signs of that yet, otherwise they'd probably be the sellers and will pin prices below so the options expire worthless. I'm sure if you trade options, you've seen it multiple times.
That's it for now, I'm off to grab a bite to eat and run some scans. I'll update if new positions are added, but don't forget to set up alerts in TeleChart or whatever system you are using. We've had a lot of halfway decent trades trigger.
RISK MANAGEMENT! Read the article linked at the top right of the blog if you haven't already!


2 comments:
Great post
Thank you very much, I just hoped it helped. Now we know why they were taking the market one day at a time-I think the jobs and Iran.
Post a Comment