
The hourly negative divergence continues
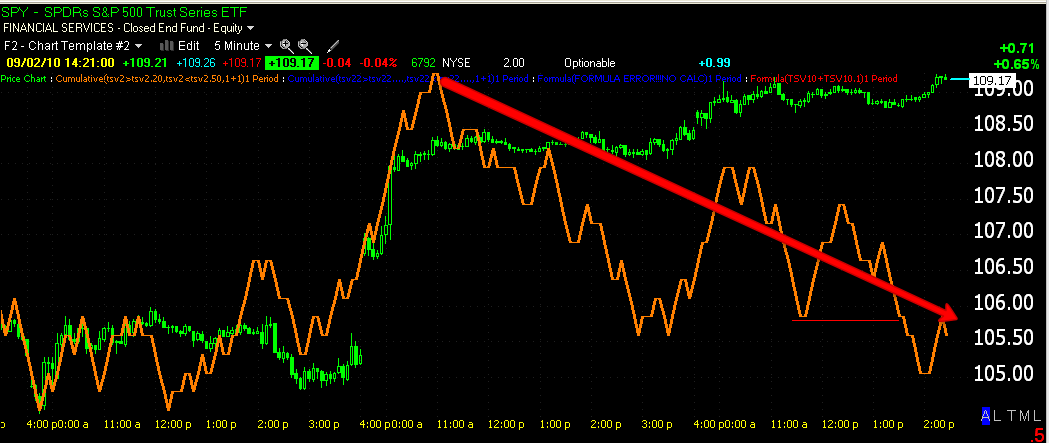


Note the reversal star in the Dow-30 as of now, also volume is falling off-buyers are not aggressive about chasing prices


Distribution is evident on the 10 min chart very clearly

Even the 1 min chart is making lower highs in 3C

The Q's hourly are in a relative negative divergence

Q's 15 min shows distribution

as does this chart of the Q's 1 min.

The Tick index confirms distribution at the highs at this point (when screen captured)
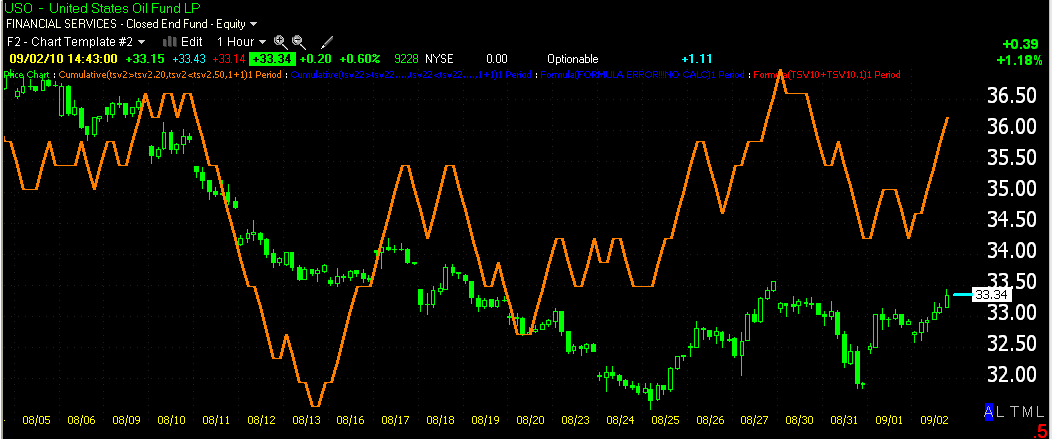

USO 1 min 3C has been in line with prices, the longer term 3C at the bottom is showing distribution

AAPL is showing the same loss of momentum seen in the broader market with buyers unwilling to aggressively bid up price as volume is low

AAPL 1 hour in a relative negative divergence

AAPL 5 min=distribution

AAPL 1 min chart is showing clear distribution

Gold's hourly divergence is negative

GOLD on a 10min looking as if it wants to bounce

as does the 1 min chart
It seems like the bounce is sputtering out, the last hour will be important. We have some important reports tomorrow a.m. at 8:30, this could be a downside trigger, especially heading into a long weekend.


No comments:
Post a Comment