Last night we were in the “Bermuda Triangle with some strange readings, the 1 minute 3C chart was negative with the 5 minute 3C charts positive. Knowing what we know about the market, my interpretation is they didn't need the 1 minute positive, they had already been tipped off on the Initial/Continuing Claims as these reports run a week behind, there was plenty of time to pickup the positions long to sell into the bounce up today. And sell they did, right from the open, it never let up on 3C. Finally at 12:45 price dropped on increasing volume. The seeming catalyst was the extraordinarily low participation of direct bidders for the Bond Auction This is, in my opinion why the interest this morning wasn't on driving prices higher, but just getting out of their short term longs that were bought specially for today. Once the SPY hit $111, the volume spiked (see the charts posted today) as the stops were hit-again, the market makers went home saying, “Honey, we can buy that new Mercedes” all because people insist on putting stops near whole numbers. Only once did we see a positive divergence and that was the last post I put out today before being held up at BAC for 2 hours to open a simple checking account.
That ended up fizzling out as an ascending wedge which showed us the market trading thinner and thinner until it collapsed near the close. The last hour of the day and increasingly into the close are the most important times of the day for institutional activity, they didn't seem to put in any effort to defend the close.
The Bond auction I mentioned did not go well, with direct bidders coming in at a pace of approximately half the average number of direct bidders. It seems they are backing off and aren't too excited about holding US government debt. With the circus in the Initial Claims this morning, who can blame them. California and Virginia literally guessed at their numbers and the US government did the guessing for 7 other states. Why even bother releasing it? The report has just about zero credibility which raises some other credibility questions as to why the Federal government is guessing about 7 state's unemployment data and releasing that as an official report. It's disturbing.
This post is going to be rather short tonight (in relative terms) because the bottom line is we need a reversal. Today's head fake to the upside which closed lower then the open looked a lot like the example chart of what I expected to see, as I posted the same chart last night, here it is again with today's price action.

I said this weekend and several times this week, don't be surprised to see something like this. After yesterday's move I said, this is what I had in mind-something more along the lines of the June reversal was what I'd expect and posted the chart of the reversal of the June rally. Looking at today's head fake price action in the red box, obviously it's not exactly the same, but as Mark Twain said, history doesn't repeat, but it does rhythm. This was close enough for me to believe that longs bought into the trap. The point of the trap is to accelerate the downtrend just like you see after the head fake in June.
These 3 hourly charts show that as of this moment, it does not appear that institutional money intends on standing in the way of a decline. They are not accumulating like we saw before the bounce that started 8/31 -9/1.


Forget all the arrows and just concentrate on the yellow 3C as of the bounce started September 1. All 3 versions of 3C show it was used to sell into or more probable to short into, however, that's just an added bonus. The real point is exactly what I laid out before this even started in late August, it perpetuates a snowball effect-the Judo concept of longs selling at deeper and deeper losses, flooding the market with supply and sending prices plummeting like we saw at the June reversal on the chart above with today's comparative activity.
So we need to see prices fall a little of their own weight and get those longs selling at a loss, that's when we get what we've been waiting for. I'd like to see a close below $109.50 on the SPY before I'm really comfortable with increasing directional trade ideas. I think we are headed in the right direction as everything we have seen since late August has come to pass, granted in its own time, but it's all played out. The head fake today, so long as it holds as the high on a closing basis is really the last component, there isn't much more needed.
If the head fake holds and is there for the reason I expected it to be there, then we should get our frenzied sell-off.
Sometimes I think perhaps I'm micro analyzing this market too much. What is important is the trend that things are heading in. So we are going to step back a little and just look at a few trends.
The breadth of the NASDAQ throughout this move up..
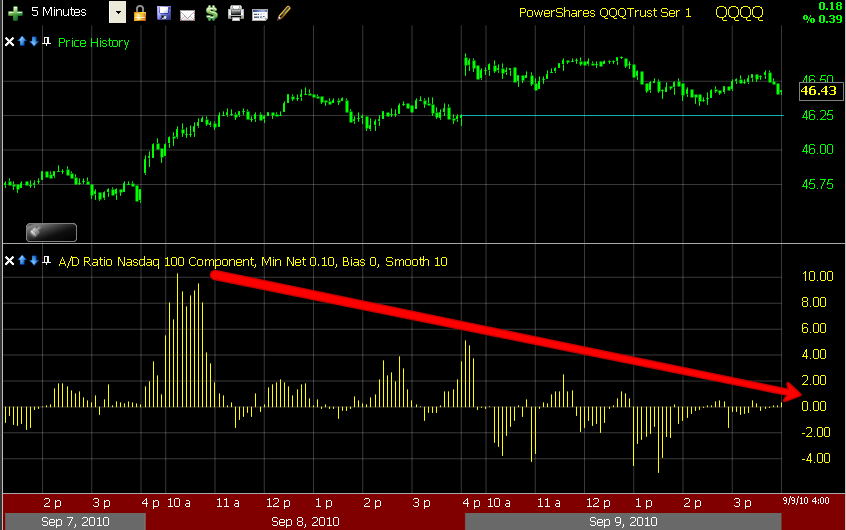
In a healthy bull move, that arrow would be white and heading up, not down.
The Dollar...

Despite the volatility between the dollar and the Euro, we have a pretty good general reversal without getting too microscopic-the dollar's relationship with stocks is an inverse one, one heads down, the other heads up so further strength in the dollar does not help the market one bit.

Here's the daily, I'd prefer to use the dollar index, but we don't have volume data for it. So here's the daily UUP
And most importantly, despite some sites talking about an inverse H&S bottom which as of now shows the exact opposite of the needed volume, we have a major top right where you'd expect to find it.

Remember, markets have for centuries run in a 4 stage cycle. Stage 1 accumulation or a base (Jan. 2009-March 2009). Stage 2, Mark Up (July-ish 2009-April 2010). Stage 3, Distribution/Top (November 2009-present) and Stage 4, Decline (what we are waiting on-starts in earnest at the break of the June lows and the red trendline.
A lot of people were faked out by a H&S top that really wasn't around June 2009, volume is exceptionally important to confirm a top so here's a simple cumulative volume indicator I created to show you where volume was heavy and light.

The pink line is the indicator. Concentrate on the rallies and sell-offs during the top. What you want to see to confirm the top is advancing volume on the declines in price and lighter volume on the advances, logically it should make some sense. Look at the volume spike on the decline forming the right side of the head. Look at the last two rallies, volume is falling to new lows, buyers are simply not buying advances, this is the key to confirming a H&S top.
So I wanted to show you the bigger picture, it's easy to get lost in the lines.
Today's dominant price/volume relationship was price up, although it certainly was a bearish day for price action, an volume down-again this is the most bearish of the 4 possible combinations, but you could have guessed that looking at the chart above as volume spikes downward.
3C 1-min ended today in a plunge down after the last rally attempt of the day failed and volume on the sell-side was huge. I see no positive divergences in the SPY right now jumping out so I'd have to guess that we are in the place we'd like to be or are heading in that direction, but again, nothing matters so much as price. A 3C divergence may help you make money, but only price moving puts it in your pocket.
As for trade ideas, I'm putting up a new list for September finally, it should be up tomorrow.
If you got into PRWT tighten up that stop a little on a closing basis, but give it a chance to show some upside follow through. The divergences there remain positive.
Tonight I want to show you JNPR Juniper.

April, a nice break-away gap that was never filled, this is like the last nail-the volume was huge as well. July it rallied with the market as tech seems to be really swinging far on the pendulum, both up and down. Then another huge break on volume. The recent rally looks way over-extended with no volume whatsoever to support it, it's like a narrowing, thinning plank-would you want to walk to the end of it? The yellow arrow shows the lack of volume.

Today's candlestick is called a "Bearish Engulfing Reversal Pattern" It swallowed 3 previous days-pretty much their entire range. JNPR opened on a gap up at its high and closed nearly at the low of the day. Today's candle alone, by itself is extremely bearish. The volume was also up today. Now this is where people always make the mistake, they look for huge volume spikes. Remember, to make money, you have to see what the crowd missed. What the crowd probably missed was the day before JNPR crashed both times, there were slight increases in volume, just like today. It's those little details people miss.
I would consider JNPR a short at the market open, unless it drops huge. I'd put a stop just above today's high, maybe 3% above it and certainly NOT at $29. Then, I'd hang back and let it do it's thing. Remember, I try to never execute a stop because of intraday volatility, only on a close through my stop, meaning the last minute or so of the day, otherwise you get stopped out left and right on otherwise good trades.
In my opinion, JNPR is headed for the high to mid teens, but if the market collapses, you can adjust that significantly lower.
Until I get the new spreadsheet up, here's a list of other short trades worthy of a serious look.
AAPL, SNDK, HPQ, CSCO, OVTI, CAVM, PG, CTRP, ISRG, HMSY, DECK, ABC and GIL
On the long side, take a look at GOK-this is a consolidation pattern that I would consider right here with a stop around $4.57
I'll get these ideas on the new spreadsheet for you, they all look good to me though.
Until tomorrow....


3 comments:
I guess the news we wait for is still to come, or until the market can digest this report. Inventory rise is not always a good thing as it could very well mean people just aren't buying.
Looks to be back testing the gap down yesterday of 111.35 area on the spy. Failed once, let's see if it does again.
The SPY has broke above the gap, lets see if it is a headfake.
Post a Comment