Sentiment is a funny thing, so are the words that accompany extremes in sentiment, "This time it's different".
I'm not going to pretend I'm a PM expert, I'm just going to show you what the market has to say.
GLD 60 minute 3C chart. You can argue against opinions and such, but there's no arguing with the fact that every time GLD has hit resistance, a negative 3C divergence has met it sending the metal lower.
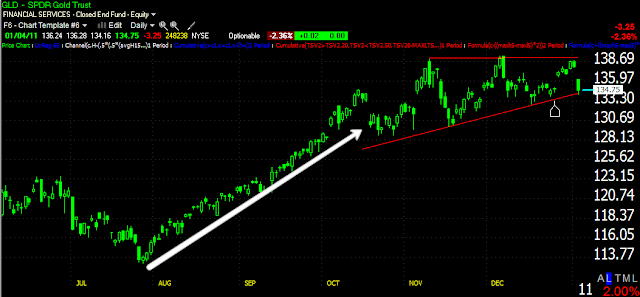
Note the very straight trend in GLD, almost looks like program trading ramping it up higher with virtually no pullbacks. Next around November we enter a volatile stage and meet resistance just as gold is hyped everywhere. It seems there's not a person who is bearish on gold. Yet, today GLD sits at the support that has held for nearly 3 months. A break of this support could be a very big and potentially profitable event. Price gets to make the final call, but GLD has certainly seen deterioration in the trend.
Here we se SLV and the negative divergences around $30-the line in the sand.
SLV has entered its own bit of volatility, contrast this chart with the one below and take note of support and where SLV sits today.
The white arrow shows another strangely bullish, orderly market, until November when volatility is introduced. These trendline/support areas are going to be important to watch moving forward.
Is interest rates about to start going up?
-
Yes, I know - it does not make any sense - FED is about to cut
rates...but....real world interest rates are not always what FED wants it
to be.
6 years ago


No comments:
Post a Comment