The settings on these Bollinger Bands have acted as support multiple times, so the red trendline is a possible downside target which is also where the wedge support trendline is.
Here's the 10 minute 3C chart showing where the breakout failed with a negative divergence
The 5 min chart shows the same, but it also is showing some positive momentum or accumulation building as would be the case in the scenario I outlined above. The market was up today, it's natural for these stocks to be down. Bottom line, I personally would stick with the trade, but I like to phase in, a little here and more when the trade moves in your favor-like breaking out. If you are going to average your cost, you do it with stocks working for you, not against you unless you have a specific plan and edge-this may be such an edge.
EDZ
EDZ is another trade I believe we have sufficient proof showing it is being accumulated in the trading range/rectangle. Yesterday as I showed you, the market was accumulating for a green open and maybe close, this effects these stocks in the opposite manner being they are inverse ETFs or short biased. Here's the charts..
Here' the daily bullish ascending wedge-to the right the rectangle that has been acting much like a base. Note the green volume spikes in that base area.

Looking at a 15 minute chart of 3C we can see price knocked down at resistance and then increasingly accumulated at support, look closely you can even see this happened yesterday.
a 10 min chart giving a closer look and also confirming the chart above, yesterday's small double top showed a negative divergence, thus prices are lower this a.m.
The 5 min chart gives an even closer look, note the multiple negative divergences at resistance, 3C just didn't move up yesterday so what I believe is minor distribution to lower prices to accumulate more, seems to have been the case. Why do I think this?
Here's the hourly chart. The white arrows are accumulation on pullbacks. Note how the drop today barely budged the 60 min chart, so the distribution didn't seem to be heavy, just enough to reverse course. I remain bullish on this trade. If smart money wants to buy more, then fine with me, the trip and gain just lasts longer. That's my analysis of EDZ.
TZA
TZA is a bear ETF on small caps-the Fed has focussed on keeping the Russell 2000 higher through the POMO/P.D. scam. This trade may be early or it may not be, it's difficult to say. As I mentioned last night, something feels amiss in this market. If the market tumbles, TZA will be one ETF you'll want to take a serious look at.
TZA 2-day 3C chart with a huge positive divergence in leading position.
Hourly 3C chart shows accumulation at the dips.
30 min, confirms the above chart, accumulation at the dips.
5 min chart showing a positive divergence/accumulation into falling prices.
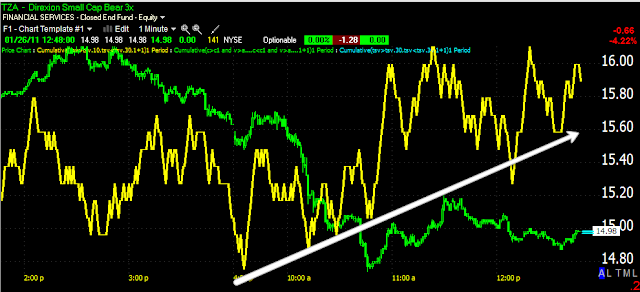
1 min chart showing accumulation on today's dip.
Again, the market works differently then what most people believe. Accumulation is a quiet event, it's not the huge volume spikes that people think is smart money buying, they're much more intelligent then to buy upon rising prices. Those volume spikes are there to make you think they are buying and when you buy, guess who is selling to you? So all these charts make sense. I'm still very much bullish on them all, just don't get discouraged by daily gyrations, in the end they don't matter and you will barely notice them on historical chart, it's only when your in the trade that they are fearsome. Make sure your stop provides you room to let the trade work and a position size that lets you sleep at night. Trading scared money is one of the cardinal sins of trading and decisions made while trading scared money are often not based in logic, but fear. This is why risk management is vital.


No comments:
Post a Comment