The market today is looking like the coalition forces, but we are seeing some signs of movement that haven't been observed in recent days in some averages. Unfortunately my data feed for the Q's has been out all day.
Here are the others.
This is about the extent of the move on the SPY, not much but something. I would make no observations based on the SPY alone.
DIA 1 min has gone into a nasty negative leading divergence
As has the 5 min DIA chart
The 15 min chart is finally starting to show some movement with a negative divergence
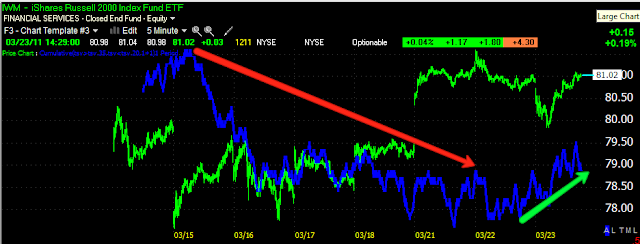
The 1 min IWM probably looks the worst, which makes me wonder what the Q's look like.
Although there's price confirmation today, it's still in a leading negative area, so this is a bearish chart as well
The 10-min seemed to peak yesterday at the open and has been in a leading negative position today.
And the 15 min chart agrees with the peak yesterday at the open which was distributed.
While I did publish higher targets possible a few days ago (which are still possible under distribution), some of these charts, such as the IWM are showing some real movement. Unfortunately I don't know what the Q' are doing and the SPY isn't doing much beyond the 1 min chart, this makes confirmation difficult unless we see the averages come unglued from correlated movement.
Here are the target's I posted Monday. The SPY is yet to hit any of them yet and considering the lack of confirmation on the SPY beyond the 1 min chart, I would still put more weight behind the idea that the at least the SPY, still has a decent chance of hitting a couple. Perhaps the IWM will diverge.
Is interest rates about to start going up?
-
Yes, I know - it does not make any sense - FED is about to cut
rates...but....real world interest rates are not always what FED wants it
to be.
6 years ago


No comments:
Post a Comment