The daily chart, yesterday we had a bearish engulfing candle on big volume-once again a sign of churning and a negative reversal signal-note the volume yesterday
The 60 min chart shows an accumulation/distribution cycle. This is how the market works, they accumulate at lows nice and quietly and then sell into higher prices, not into the decline. They have a large position and they must sell into demand to keep prices rising rather then falling so it happens a little bit at a time, this is why distribution can take some time to work out and why we watch multiple timeframes to try to ascertain wen these events begin and end.
The 30 min chart also shows signs of the accumulation cycle and the distribution cycle -in the red box is our bearish engulfing candle yesterday. Note hoe negative 3C has been during this event.
Te 10 min chart puts a very fine point on yesterdays' distributive action in NKE.
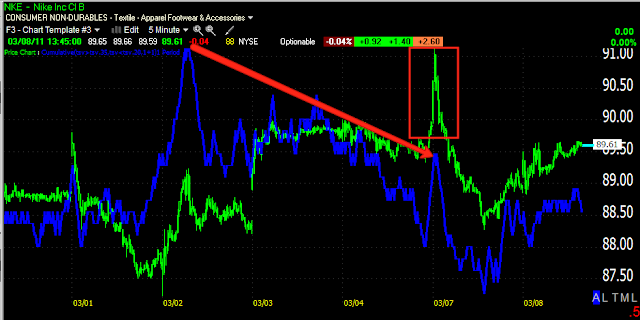
As does the 5 min chart.
The 1 min chart can't stretch back any longer historically, but there's a negative into yesterday. today we have confirmation only.


No comments:
Post a Comment