Starting with the 1 minute advance / decline ratio which has shown negative readings the last several days as we see here, fewer NASDAQ 100 stocks advancing into higher prices.
Now that the trend is developed, it's easier to look at the 15 min chart to get a feel for the overall advance and we can see that the daily charts like the one above have been accumulating into the longer 15 min chart.
Here's another we've been watching, the 250 bar new highs/new lows on a 1 min scale.
And the same indicators on a 15 min scale shows some unusual activity today.
Here's a McClellan Oscillator, note the positive trend at the start of the advance and the trend as the advance matured.
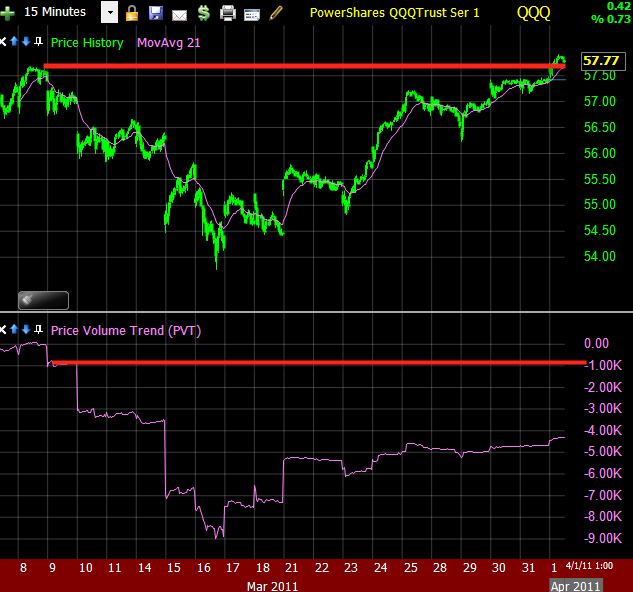
This indicator is PVT or Price/Volume Trend, it's been pretty bleak throughout the advance when comparing the indicator to price at two relative levels. A simplified explanation is that volume just hasn't been there in the advance which is taken to suggest that traders are less willing to chase higher prices.


No comments:
Post a Comment