AMZN reports after the bell.
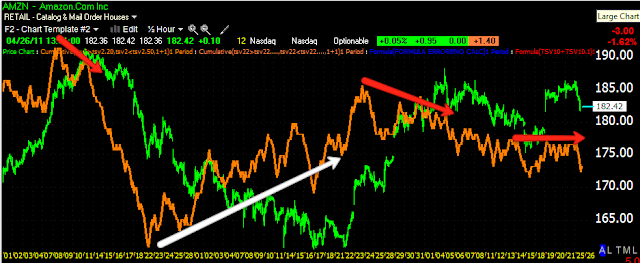
On the hourly chart there was an extended accumulation period, so it's not surprising AMZN has run for about a month. What bothers me about this chart is the extent of the accumulation, but there's no distribution signs here.
Moving to a more specific 30 min chart, an accumulation zone can be seen and several points of distribution, again, not exactly commensurate in size of the accumulation zone.
On the 15 min chart we are looking at the more recent run with accumulation and distribution into a largely lateral trend.
The 5 min just confirms what we are seeing above.
This isn't the typical earnings chart that I'd be excited to publish because of what I mentioned about the 60 min chart. However, I'll go ahead and give my opinion on the most likely outcome (which is not to say they'll beat or miss, that's irrelevant, it's how the stock reacts after that we are looking at). As I said, the lack of strong signs of distribution are a bit bothersome, however the trend up has been long enough that they could have fed out shares in small increments spread over a longer time period. Taking that into consideration and the fact we aren't seeing any heavy accumulation as of this moment (remember though how quickly GOOG changed, in the last hour of the day), my guess is AMZN will not have a good reaction to earnings in the coming days. If you are interested in trying to play this, definitely get in touch with me before the close so we can make sure there's no GOOG-like, last minute heavy action.
Is interest rates about to start going up?
-
Yes, I know - it does not make any sense - FED is about to cut
rates...but....real world interest rates are not always what FED wants it
to be.
6 years ago


No comments:
Post a Comment