So on a micro scale, and a faster paced scale, I believe the same is happening in earnings right now. They didn't need JPM to run 5% today, they needed a gap up and I believe it is because the bulk of earnings season isn't going to be very pretty. So today they could easily have used the gap up (and remember yesterday we saw some accumulation in the market and also some great shorts that just needed a little pullback-today gave them that).
So I'm looking forward at tomorrow's earnings, so far the significant finds are HAS pre-market, GOOG and JBHT post market. So if we "assume" that one or most or all of these companies will disappoint, then today would be the day to do some last minute short positioning.
Lets take a look at the stocks reporting tomorrow (you have to bear with me as this is speculative theory, but so was yesterday and that came to pass).
HAS reporting premarket


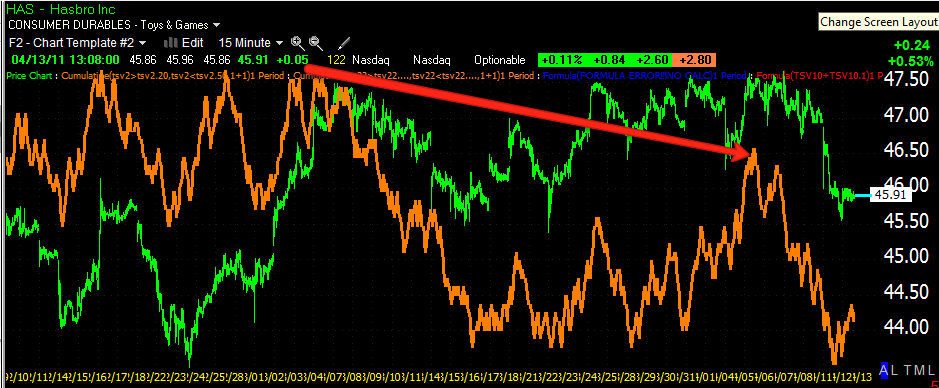

On the 10 minute, we can see a quick false breakout right before the plunge started, there was a deep negative divergence there (in the red box) and we have a little positive divergence currently.
Now, I don't know if HAS disappoints and moves the market lower, I suspect the end of day 3C readings may tell us more and give us a better idea. It's possible that HAS does fine and give Wall Street another day to sell short before the GOOG earnings out after market. In general, HAS doesn't look very hot to me, I'm not seeing (at this point) any strong accumulation suggesting a great report.
GOOG-This will be a biggie.


JBHT After Market-JBHT is transports, thus is a vital indicator of the health of the economy. Rising fuel costs can't be good for this one and many sentiment indicators from consumers have been ugly so a bad report here is a good probability, but more importantly will be the forward looking implications. I don't see much to stop the advance of gasoline hitting all time record highs, so there's a good chance JBHT will fall into the margin squeeze category.


15 min 3C negative divergences and an interesting one into a breakout high on the gap open this morning.

The 10 min chart shows the same in greater detail

We'll see what happens, but that's what I'm thinking right now.


No comments:
Post a Comment