Take a look at DUG, this is a long term chart pattern that started with a bullish descending wedge, and like most wedges over the last few years, instead of a quick upside reversal, they've spent months carving out bottoms or tops in the case of bearish ascending wedges. I think DUG is good for at least a swing move up, ultimately it has a pattern implied target near $70, but that will take time to achieve, first it needs to break out of the base it's been working on.
Here's the bullish descending wedge and the base after the wedge, it's substantial.
The daily 3C chart as well as a positive divergence in RSI which is indicative of a strong base.
The hourly chart shows a pullback from resistance, much like the SPY did on 6/21-6/22. The two yellow arrows denote our typical false breakout above resistance on a negative divergence sending DUG lower.
The 30 min chart shows the same negative divergence at resistance and the following negative divergence on the false break in the red box, note the positive 30 min leading divergence now.
The 15 min hart shows the false breakout n greater detail at the red arrow and the recent positive divergence.
And the 10 min hart showing DUG ready with a positive divergence.
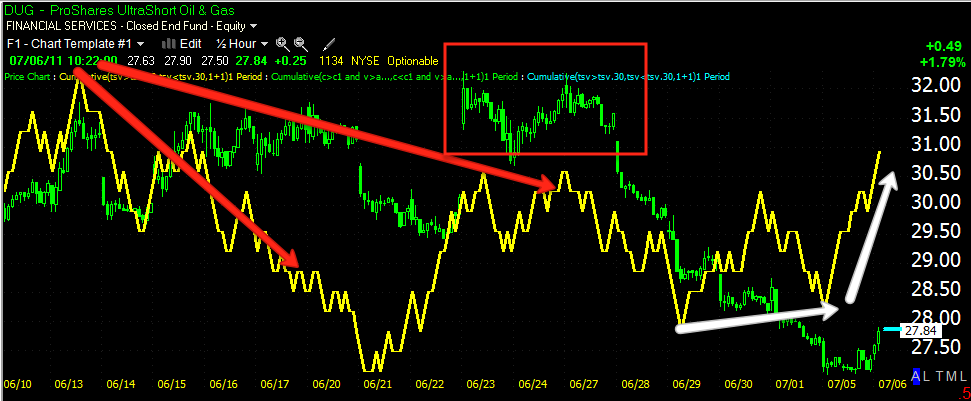
This 50-bar 10 min chart has worked well for DUG intraday and has served as a pullback area in both up and down trend moves. You may want to set an alert for the area in the white box to possibly pick up DUG on a pullback, but even without a pullback, I like DUG in the area.
On another note, I pulled a boneheaded move and spilled coffee on my keyboard so a I try to get posts out quickly, you may notice some missing "C" or "I" as the key board is quite sticky.
Since I started this post, DUG has pulled back a bit.


 | Theme by Thur
No comments:
Post a Comment