I have a lot of charts that I want to get out quickly so i won't be commenting on each. Just remember what I said last night about the shorts have been squeezed, it wouldn't surprise me to see the longs get set up n a bull trap, which would require some breakouts from significant areas. Still the market tone continues to deteriorate. If you have questions on specific harts, let me know.
DIA
DIA makes a new marginal high above local resistance
DIA 50 bar 10 mn chart as support, there's a recent break and the average is starting to flatten.
Hourly linear regression channel
DIA hourly ADX trend change and Trend Channel close to a stop out, starting to head sideways.
DIA 60 min 3C chart, RSI is negative and Stochastics at 100
DIA 30 mn chart, RSI negative divergence
DIA 1 min chart, backing off the highs of the day w/ a negative divergence.
IWM
An ideal false breakout for the IWM would be around $85.
The daily 50 sma has acted as support in the past, this may have been a significant crossing recently.
IWM intraday 50 sma (15 min chart ) acting as support, a recent break and a move just above recent resistance. RSI went from confirmation of the trend to a negative divergence.
Linear regression on an hourly chart of the IWM, starting to trade n the lower channel, volume has been dismal.
IWM 10 min negative divergence after days of confirmation.
The IWM 5 mn hart looks bad at new highs for the bounce.
IWM 60 mn trend channel has held the trend, starting to flatten out. ADX signaling a weakening trend with a cross below 40.
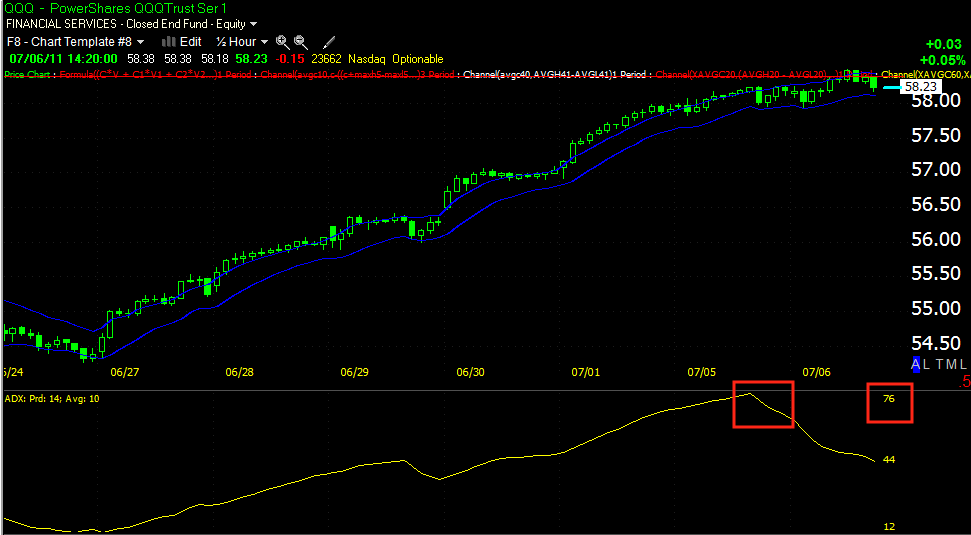
QQQ
QQQ makes a marginal new high above local resistance, volume is dismal (daily).
QQQ 50 sma (15 min chart) acts as support, the average is starting to flatten. RSI is negatively divergent.
QQQ hourly linear regression shows the Q's trading toward the bottom of the channel.
QQQ 30 min trend channel has held the trend, after a break above local resistance it starts turning flat. ADX turns down from over 75! This is signaling a weakened trend.
QQQ 30 min 3C has been in confirmation (green arrow) and now is going negative.
QQQ 15 min 3C is in a nasty negative divergence.
QQQ 10 min 3C also a nasty divergence.
Q's hit a negative divergence (1 min hart) after breaking through local resistance.
SPY
The SPY is a bit away from a solid breakout that could lead to a head fake, but the other averages, especially the DIA have already made such a breakout. SPY is n fact having trouble with resistance of the past 3 days.
SPY Bollinger Bands are nice and wide throughout the trend up, the SPY was also walking the upper band n a show of strength until recently.
The 30 min SPY Bollinger Bands show good volatility on the move up, recently they are squeezing very tight considering the past trend, this is indicative of a directional move about to take place.
SPY 15 min 3C in confirmation (green arrow) and now a negative divergence
The SPY 10 min 3C chart continues to fall apart.
The SPY just peaks above resistance of the last 2-days with a negative divergence there.
SPY Trend Channel (60 min) is now turning lateral, ADX signaling a weaker trend as it crosses down fro nearly 60!
There's still room for an upside head fake, keep the possibility of a Crazy Ivan in mind too, that's when there's a shakeout to the downside and long side. I think a Crazy Ivan is a high probability.


 | Theme by Thur
No comments:
Post a Comment